

it's gonna be may

Hi, everyone! Welcome to May! Can’t believe we’re already a third of the way through 2021…
With April in the books and new a month beginning, I wanted to review a few important charts to monitor for the next couple of months.
recap
Before diving in, let’s review some of the last few posts.
easter: We highlighted the bullish seasonality for $SPX in April and the relative ranking of $SPX versus the other areas of the world — Ex-U.S. Developed Markets ($EFA) and Emerging Markets ($EEM).
Here’s the $SPX monthly chart — fresh all-time highs (“ATHs”) and a 4.72% price return for April, nearly double the average return over the last 20 years.

We mentioned that Developed Markets were the next best region over $EEM. $EFA had a good month as well returning 2.49% and closing at the highest level since January 2008!
reviewing real estate: We highlighted the interesting setup in the Real Estate sector ($XLRE) relative to the S&P 500 ($SPY) and noted some potential names in the sector. $XLRE turned out to be the best performing sector in April, returning 7.79% in the month and closing at ATHs!
Here’s the $XLRE daily chart. Lots of room to run if $42 holds.

Additionally, every name from our real estate watchlist had positive returns in April. Regency Centers ($REG) was our top performer, returning 11.82%.
rotating back?: We highlighted the potential for a rotation back into the growth areas of the markets and took a peak some important relative relationships.
Here’s the Nasdaq 100 ($QQQ) versus S&P 500 ($SPY) chart we were watching. Still hanging below the tech bubble highs (red line) and consolidating. Whichever way this breaks will tell us a lot about how we want to be allocating our money.

We also briefly commented on inflation measures using $TIP/$IEF as an inflation proxy. The cyclical inflation story remains intact.

dollar glance: We highlighted the bearish seasonality for the U.S. Dollar ($DXY) in April. The $DXY ended up falling 2.06% for the month, double its average negative return over the last 20 years.
Here’s the daily $DXY chart — now stuck between a rock and a hard place.

Alright, so that covers our April analysis. What should we be watching going forward?
charts to watch
Ex-U.S. Developed Markets ($EFA): We highlighted many of the best and worst of the country charts in our wanderlust post. Since then, there have been some great breakouts, especially in developed markets.
Here’s the $EFA monthly chart. Underlying strength across countries is robust.

Here’s the Eurozone ETF ($EZU). Decisively above those early 2018 highs before the cyclical bear market began.

Emerging Markets ($EEM): $56 remains the key overhead resistance for $EEM, the laggard of the major regions. We can use other related equities to gauge whether we are simply consolidating before the next run to ATHs or whether the bull has run its course.

Here’s the Frontier Markets ETF ($FM). $FM contains less-developed countries than even the $EEM ETF, like Kuwait, Morocco, Vietnam, and Kazakhstan. Not exactly the most risk-off areas of the world. If they can manage to stay above the pre-COVID highs, $EEM is probably fine.

Semiconductors ($SOXX): Semis have been the market leaders for years and an important component of the global growth narrative. This makes sense as semis are in everything today — smartphones, automobiles, PCs, industrial equipment, etc. We really want to $SOXX back over $433 as soon as possible. If the global chip shortage doesn’t abate soon, the spillover into other industries may pose a problem.

Here’s $SOXX/$SPX — rolling over but still above the early March lows.

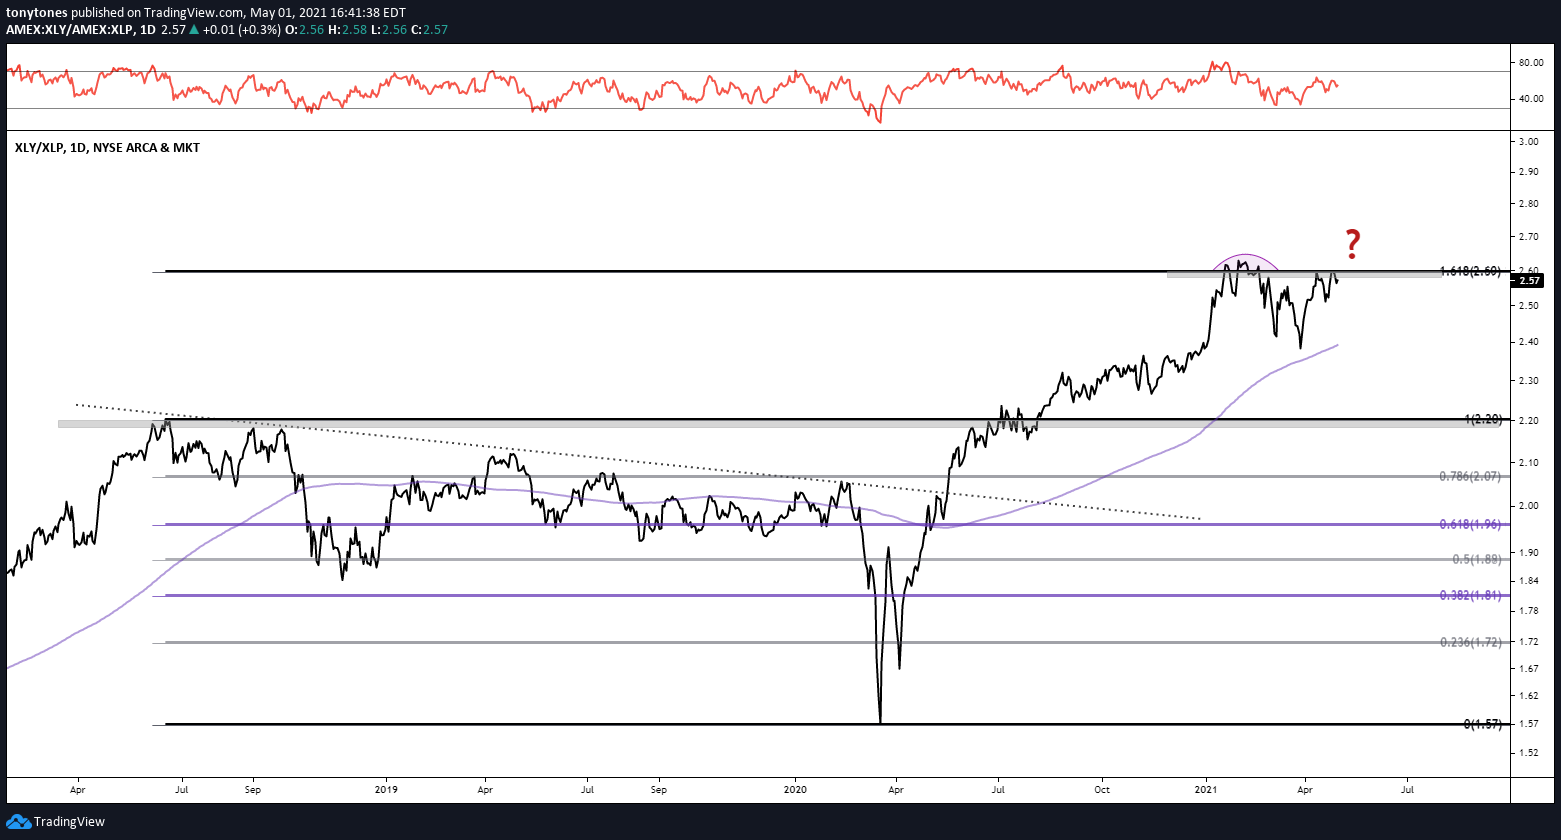
consumer discretionary ($XLY) versus consumer staples ($XLP): Semis are important but the best gauge of risk-on versus risk-off environments is arguably the relationship between consumer discretionary and staples stocks. If discretionary is leading, we can imply that investors are confident in the consumer’s pocketbooks.
A break above 2.60 in the relationship would be a great signal that investors are still optimistic.
commodities: As we noted in our hyperinflation post, commodities are important pieces of the inflation story. Inflation is simply the change in the prices of things.
Here’s the Thomson Reuters Core Commodity CRB Index ($TRJEFCRB) — breaking through the GFC downtrends and into the all-important $207 level. That level has been a major pivot many times since the late 90’s and will tell us everything we need to know about what’s next.

Here’s the Base Metals ETF ($DBB) — breaking out from the early 2018 highs before the last cyclical bear market.

Here’s the Agricultural Commodities ETF ($DBA) — breaking the GFC downtrend and testing the resistance around $18.4. Looks like the potential for a major trend reversal to me…

Crude Oil Futures ($CL1!) getting through $65/barrel is the last piece of the puzzle to kickstart a full-on commodity bull market.

That’s it for me. Hope you all have a wonderful rest of the weekend and a great May!
Cheers!
