

Happy Sunday, friends! Hope everyone had a great weekend.
If you are newer to tony charts, please don't forget to subscribe and get each post sent directly to your inbox.
What a great start so far in April for U.S. equities. So far the seasonality we outlined in our Easter post has played out nicely. Here’s that chart again.

And here’s a look at a various equities from the start of the month.
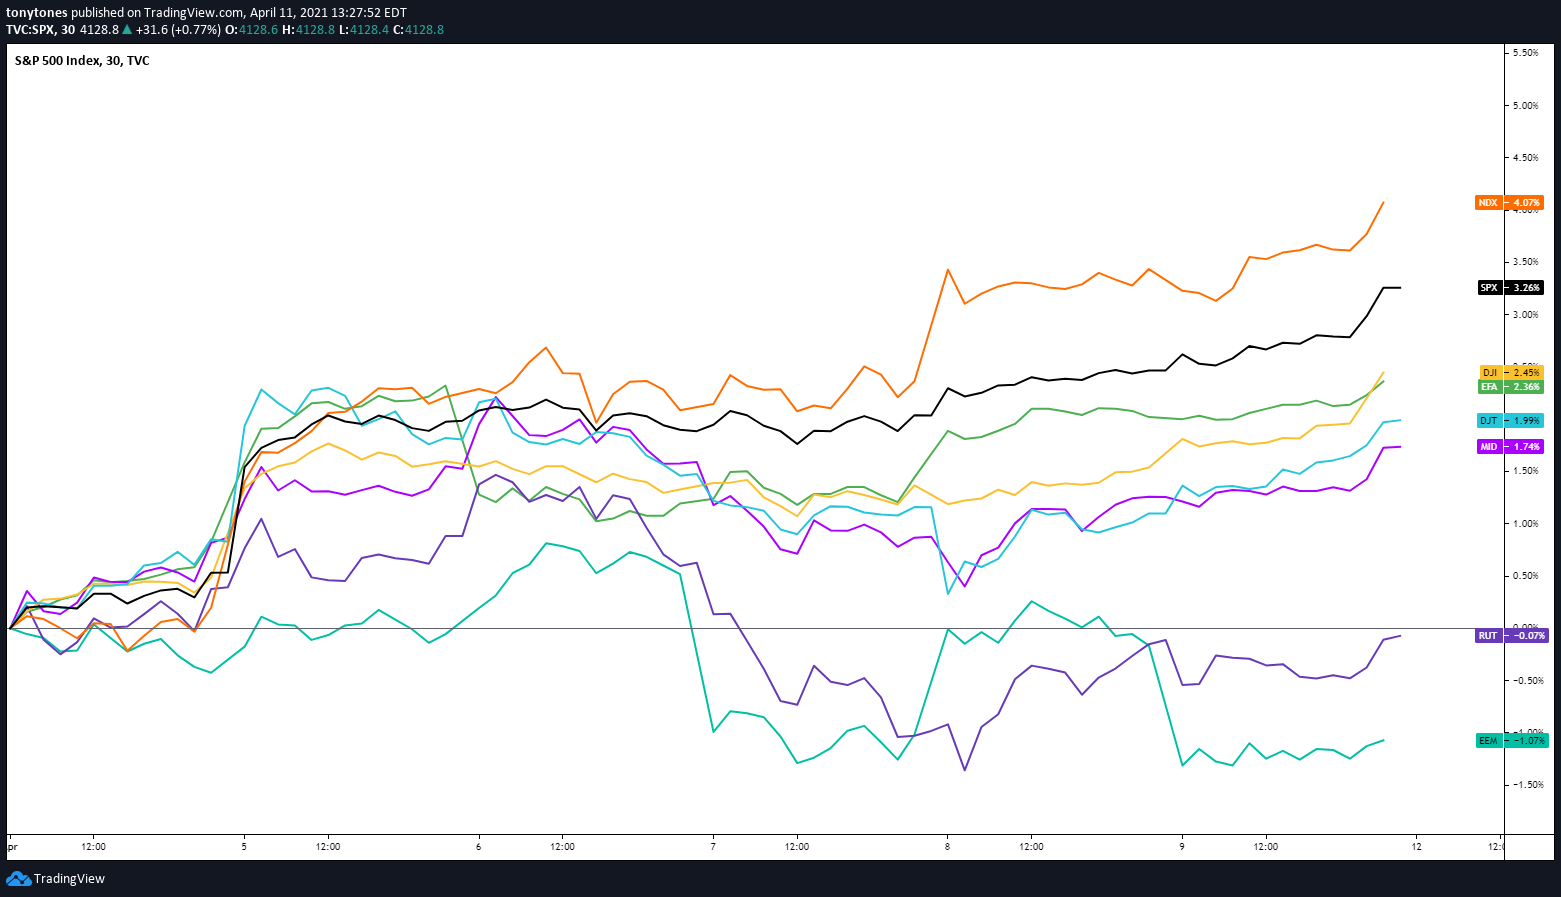
Rotation continues to be the lifeblood of the market. The Nasdaq 100 ($NDX) has gone from laggard to leader recently, returning over 4.0% in April. Other aspects of the Easter playbook have also worked out well thus far — U.S. large-cap equities ($SPX) are leading, followed by Developed International ($EFA) and then Emerging Markets ($EEM).
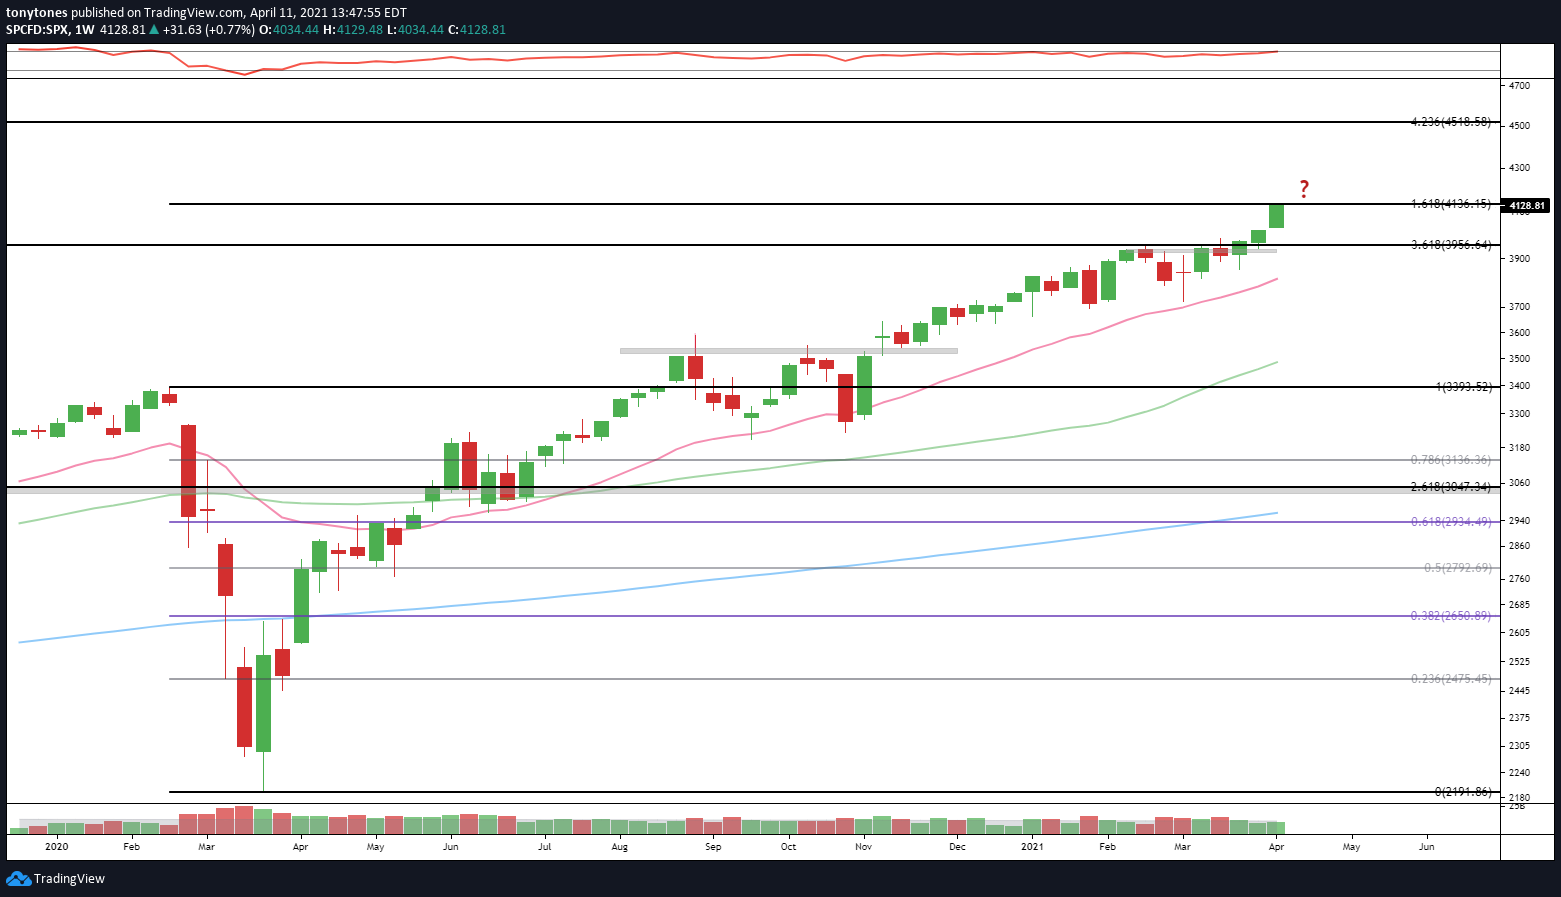
Let’s quickly review the previously mentioned levels and targets.
S&P 500 ($SPX). Rocketed higher through the $3,957 level we’ve been targeting since our first post in early January. The next target we cited in the north america post was $4,136, which is the 1.618 Fibonacci extension from the entire COVID-19 crash. Some consolidation around there would be fine after a great start to the month.
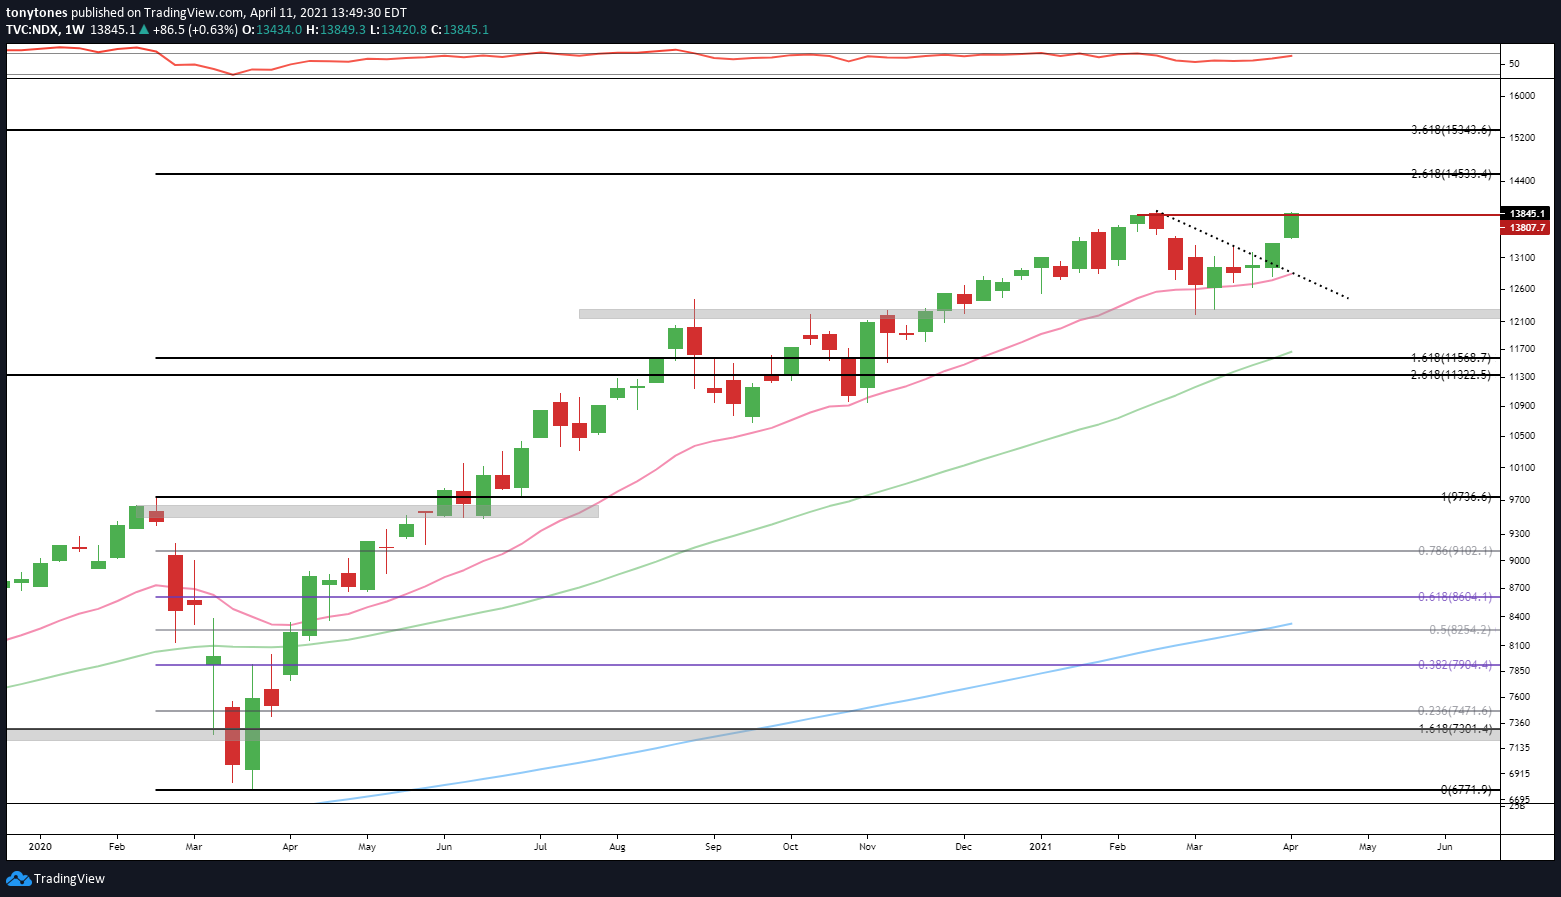
Nasdaq 100 ($NDX). Fresh all-time highs (“ATHs”) on a weekly close after a shaky February and March. If those highs can hold around $13.8K, look for the tech-heavy index to target $14,533 next, which is the 2.618 extension from the COVID drawdown.
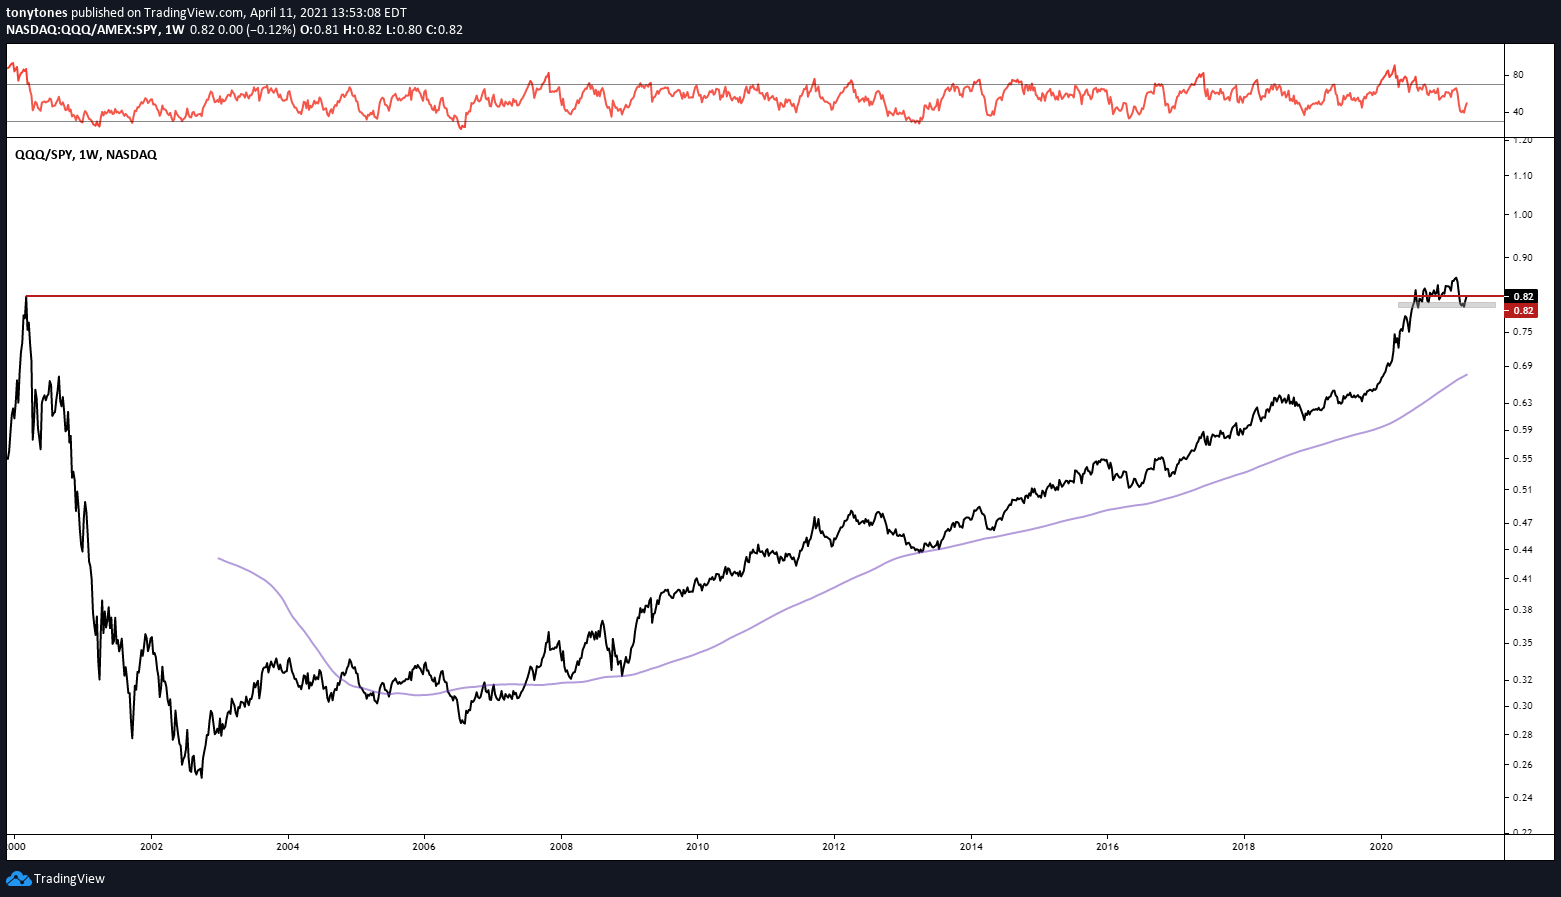
Looking at the relative relationship between the Nasdaq 100 ETF ($QQQ) versus the S&P 500 ETF ($SPY) things get a little more interesting.
Here’s the long-term weekly chart showing the Q’s trying to stay above the tech bubble highs of the early-2000’s. We can use those old highs are our line in the sand — overweight technology ($QQQ) makes sense above there, underweight tech below.
Here’s a closer look at the daily chart of $QQQ/$SPY. We can see that the Q’s had a false break lower in early March versus $SPY.
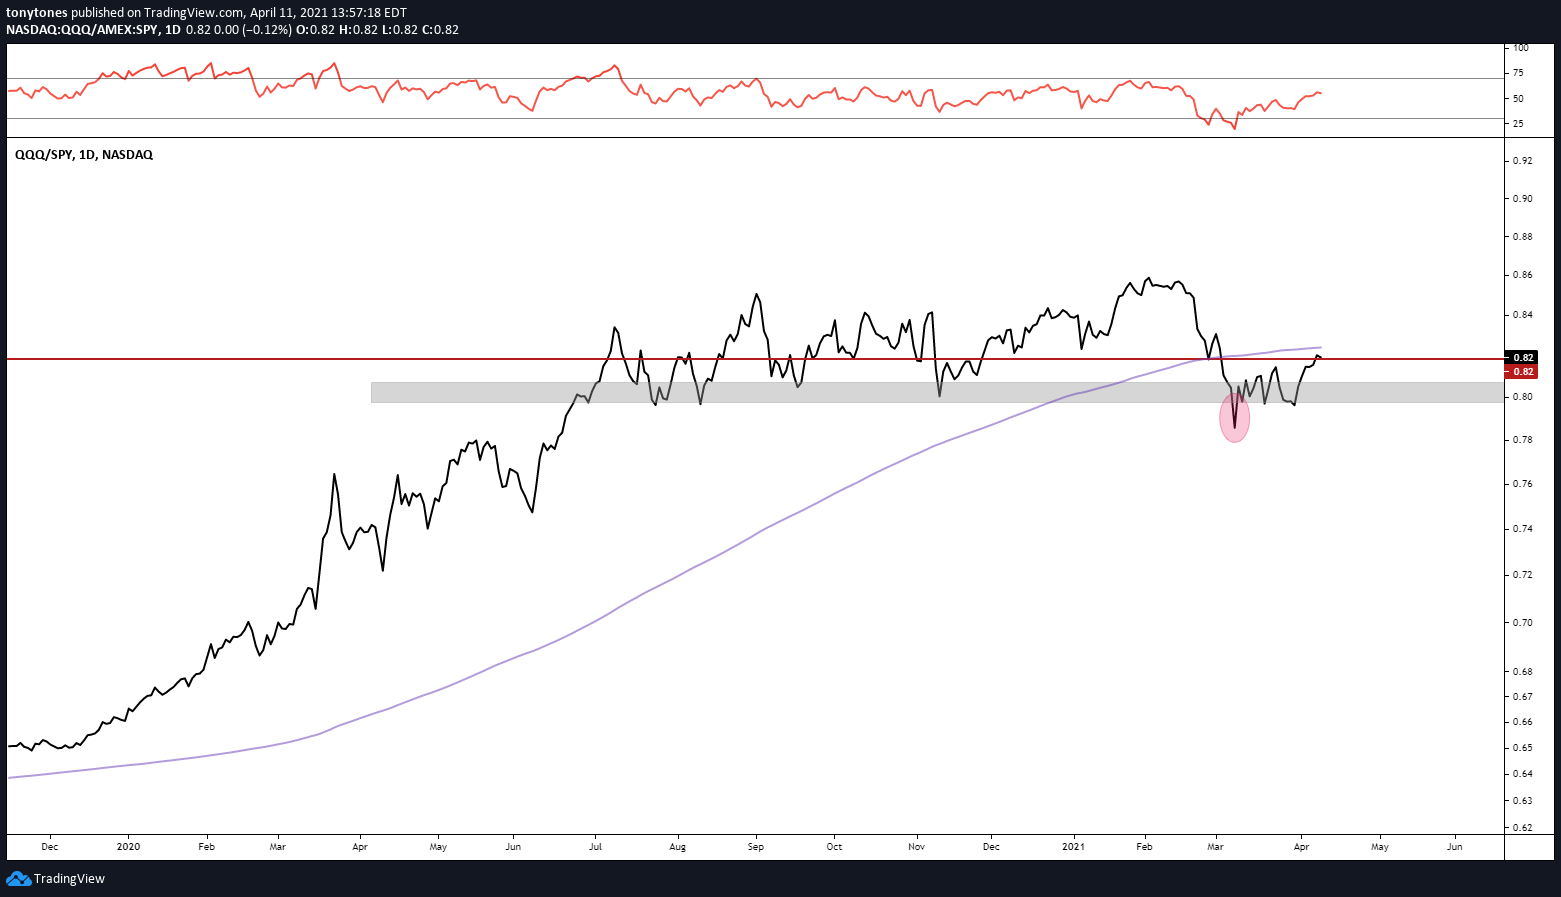
As I learned from respected technician, JC Parets, from failed moves come fast moves in the opposite direction. Keep an eye on these two here.
Along the same vein, take a look at the relative chart of the S&P 500 Growth ETF ($IVW) versus the S&P 500 Value ETF ($IVE). Growth has broken upwards through what appeared to a bear flag continuation pattern downwards. Another failed move.
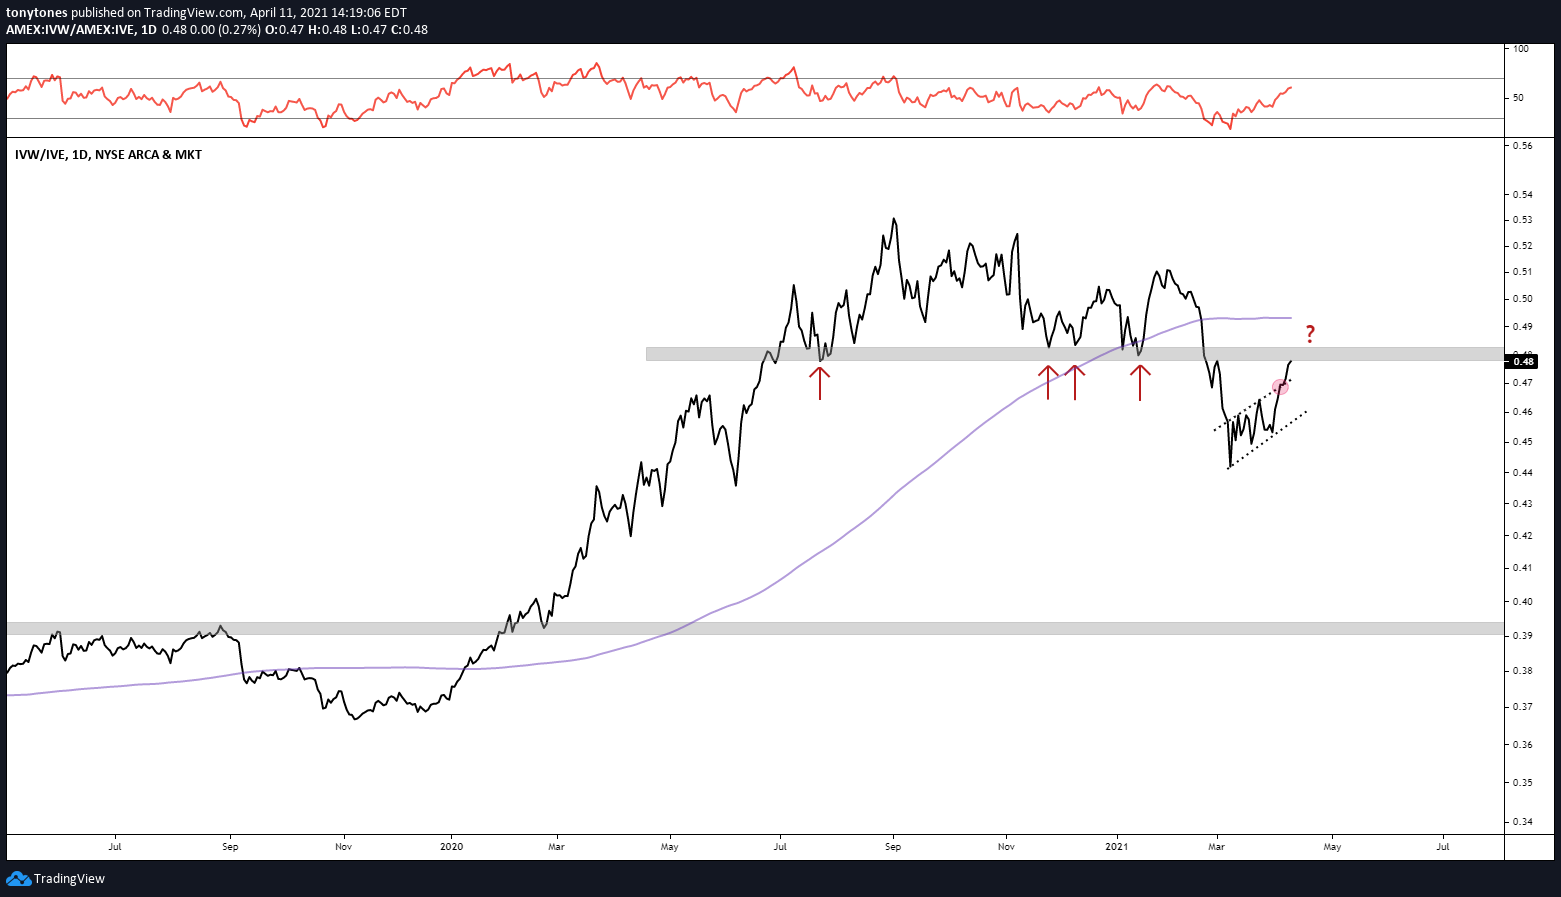
This relative chart is less constructive that the $QQQ/$SPY at the moment, as former support may act as resistance here soon. Let’s see how that plays out. This is important given the recent bias towards value stocks.
takeaway
Outside of some rotation under the surface, much of the story remains the same. Equities continue to be the best asset class, primarily in U.S. large-caps and the transports ($DJT). If the Nasdaq 100 can hold its former ATHs and continue to gather strength relative to the broader market, a tech/growth overweight will be the key to future outperformance.
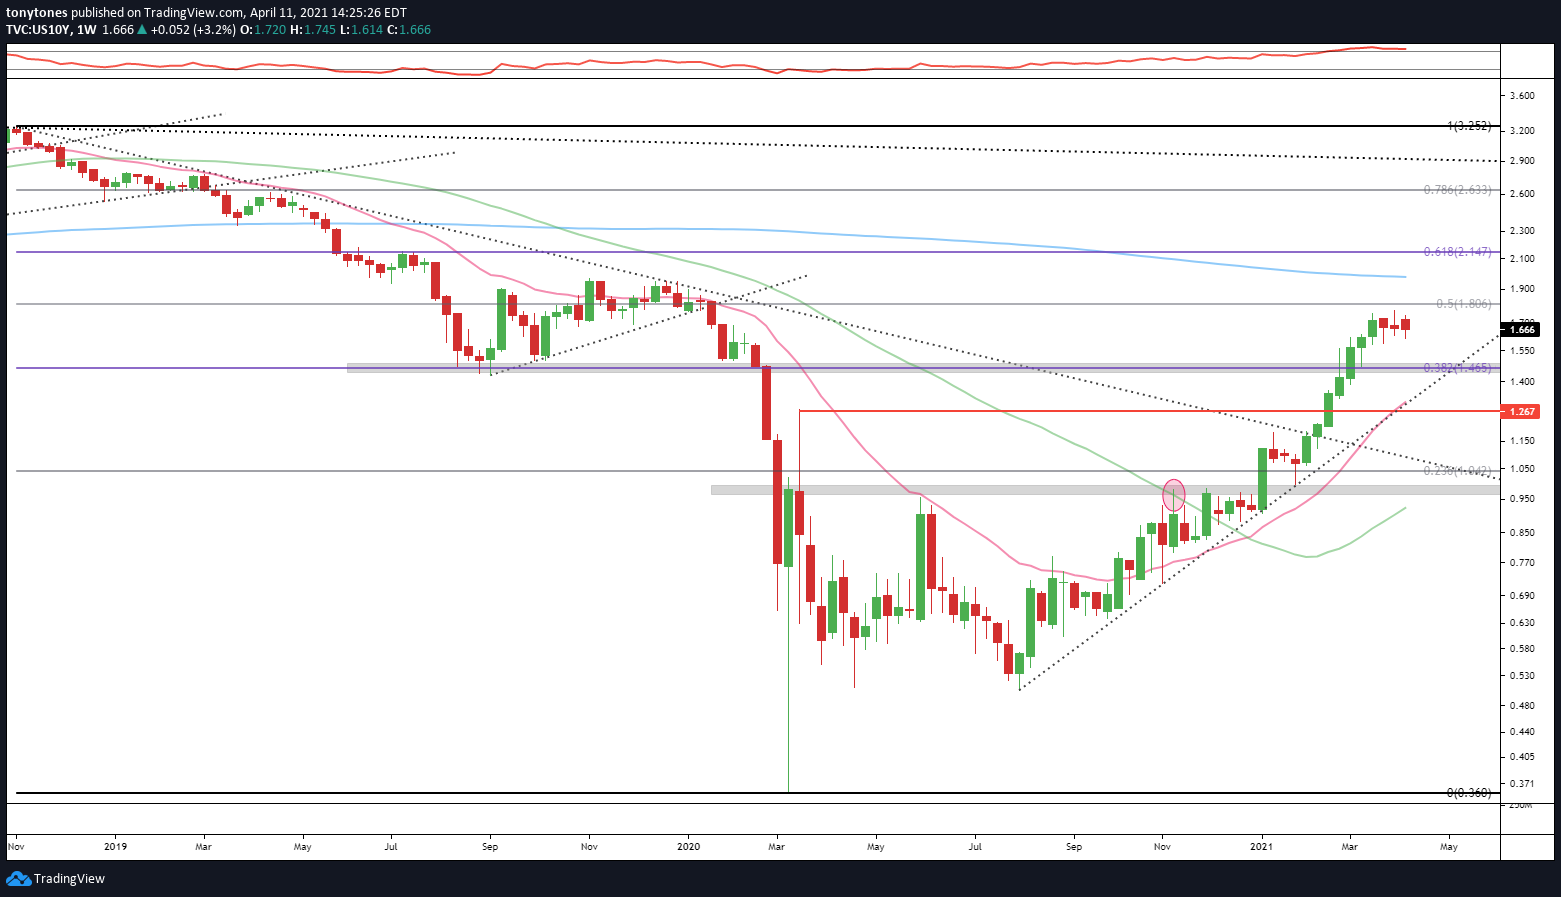
From an intermarket analysis perspective, the rates market is very important.
Here’s the U.S 10-Year Treasury Rate ($US10Y) consolidating in the range between our two most recent targets, 1.465% and 1.806%. Growth-biased equities are acutely sensitive (negatively) to higher rates.
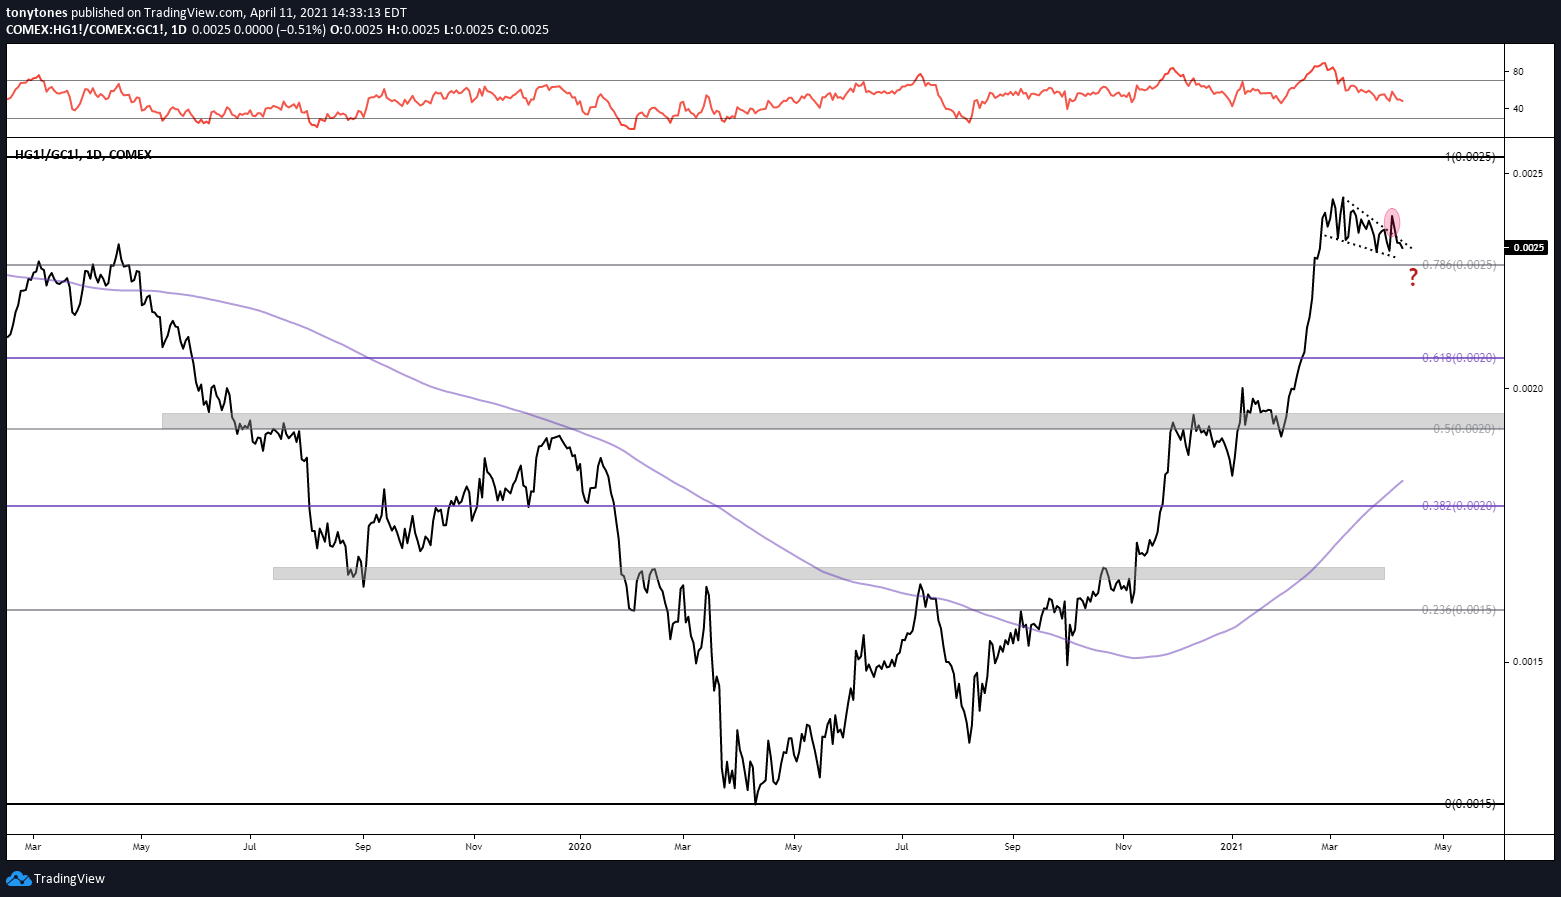
Using the relative chart of Copper Futures ($HG1!) versus Gold Futures ($GC1!) as a proxy for the US10Y, we can see a failed bull flag break upwards and some choppiness since. A lower move in this relationship implies a lower 10-year Treasury rate.
Inflation is another driver of interest rates. To gauge inflation sentiment, we can use the relative chart of the $TIP/$IEF , which compares the TIPS (“Treasury Inflation-Protected Securities) to their non-inflation-protected counterparts.
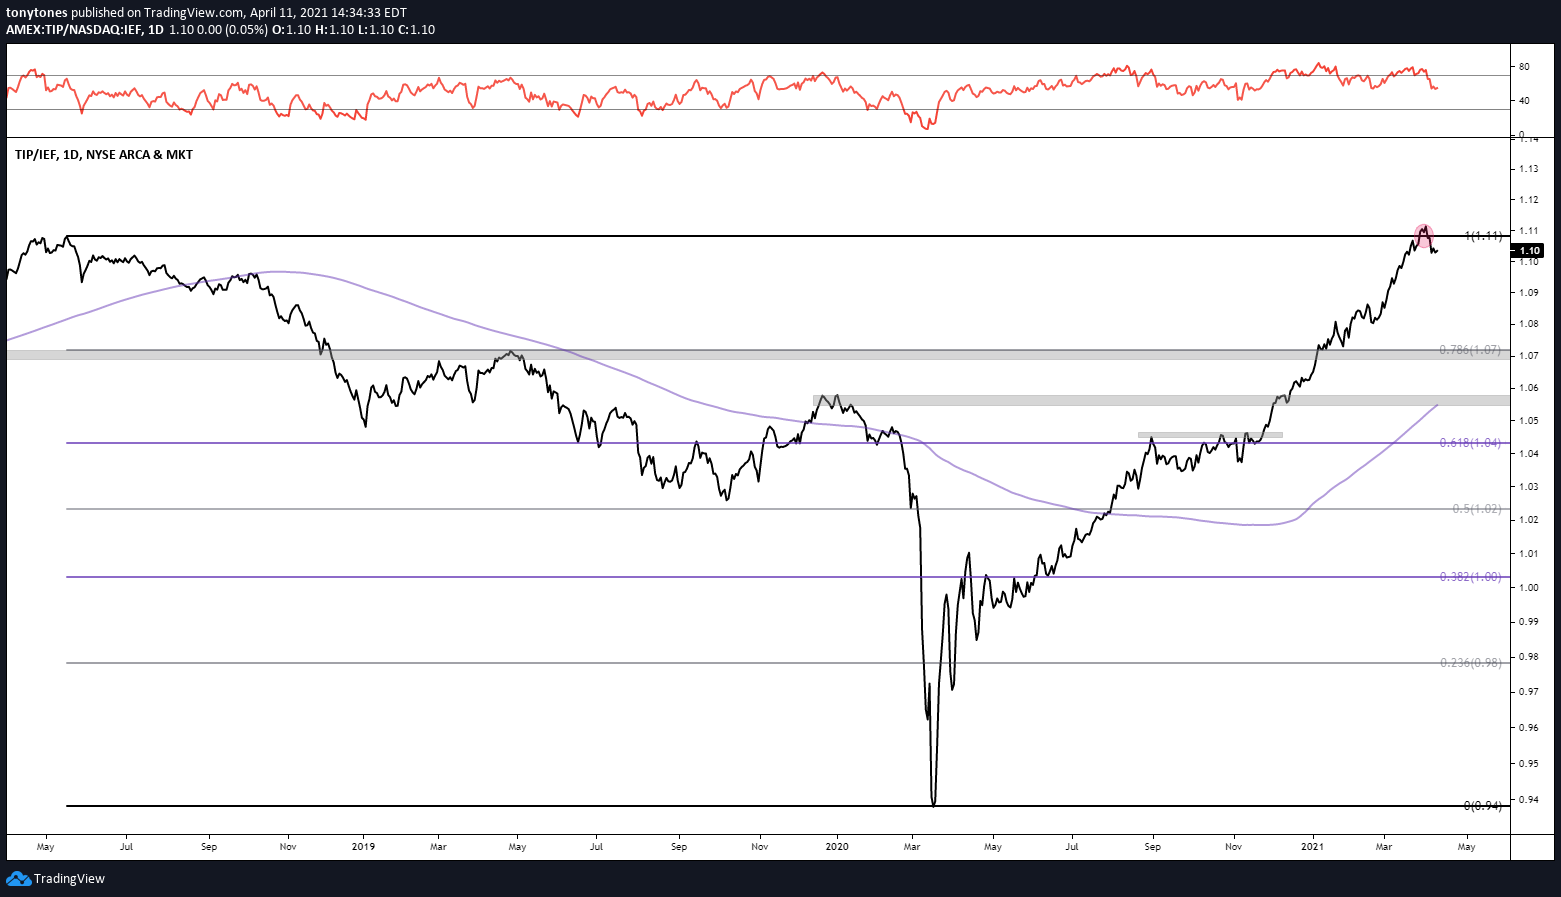
Another failed breakout at the former highs from the Spring of 2019? Maybe. Or maybe just a pause in the epic rally from the COVID lows, similar to the move we’ve seen in the rates market. You can refer back to my hyperinflation post to see my charts on the various inflation components I track every week.
Lots to watch!
Have a great Sunday evening! Be back soon.
Cheers!