

Happy Easter to all who celebrate! The first quarter of 2021 is officially closed and we made it through another interesting March in the markets. Time just keeps flying!
Despite some volatility and small corrections in some areas, the bigger picture largely remains intact. March concluded with new monthly all-time highs (“ATHs”) across many segments of the market — the S&P 500 ($SPX), the Dow Jones Industrial Average ($DJIA), the Nasdaq 100 ($NDX), the Russell 2000 ($RUT), the S&P 400 ($MID), and the Dow Jones Transportation Average ($DJT). You can review the key levels from those charts in my last post.
Logging monthly ATHs during what is typically a seasonal weak spot for $SPX is a good sign. As the seasonal charts from Equity Clock shows below, weakness in March is historically followed by strength in April.

April had actually been the strongest month over the past 20 years, being positive 80% of the time and returning 2.5% on average.

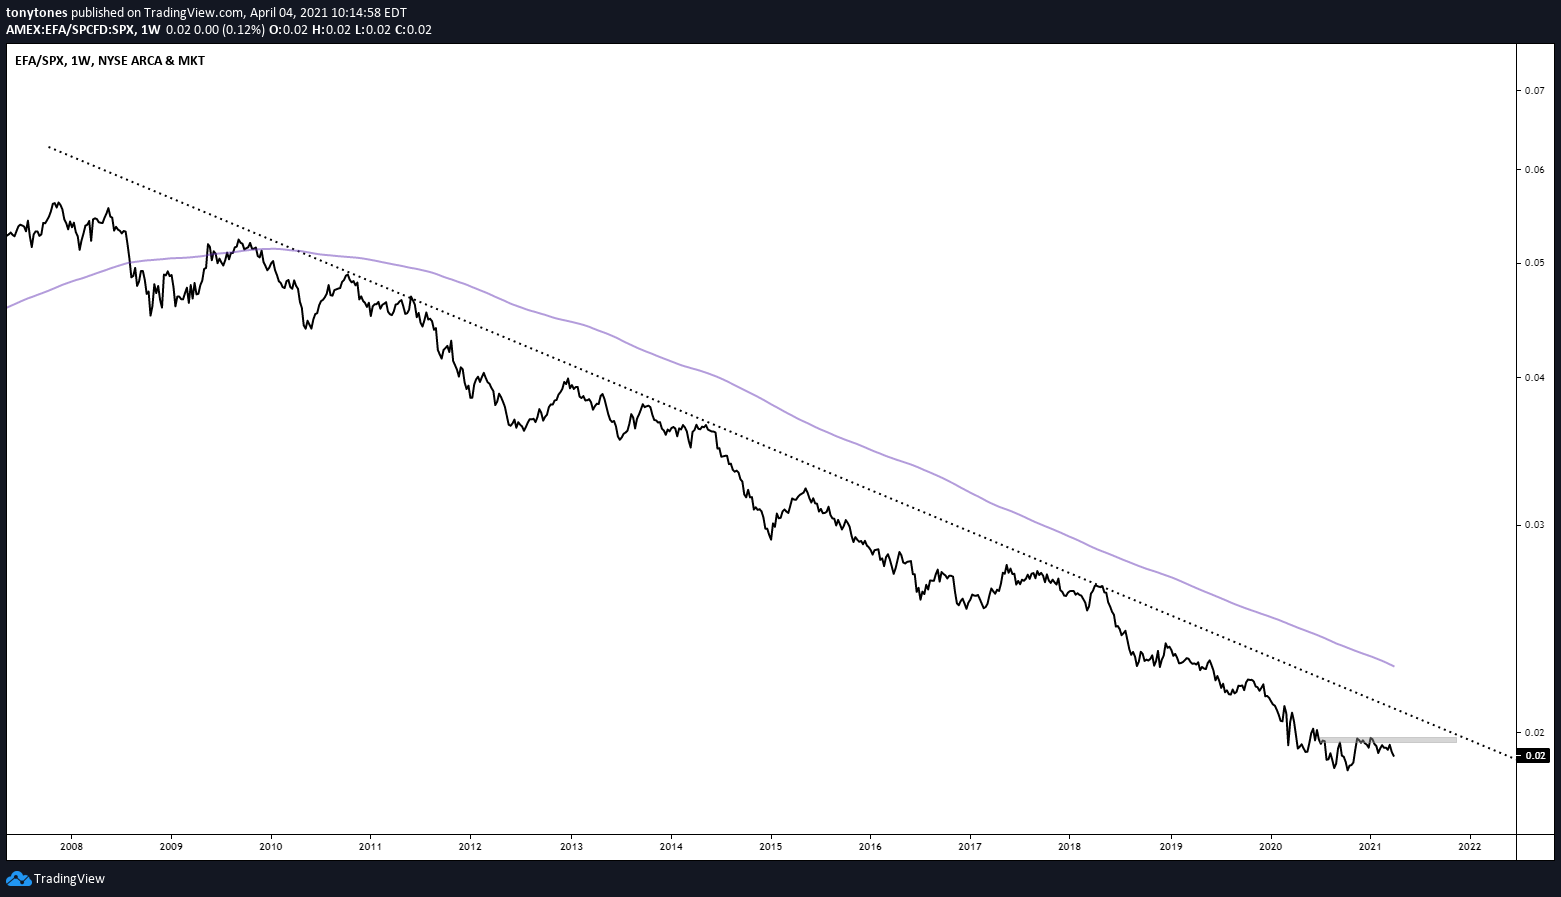
Breadth among equities remains strong, especially in the U.S. as the U.S. Dollar continues to catch a bid. As it stands, U.S. equities look best, followed by Developed Markets ($EFA) and Emerging Markets ($EEM).
Here’s $EFA versus $SPX still stuck below overhead supply within a longer term downtrend.
Here’s $EFA versus $EEM. Developed markets moving higher after finding demand right where it broke out relative to EM back in early 2013.
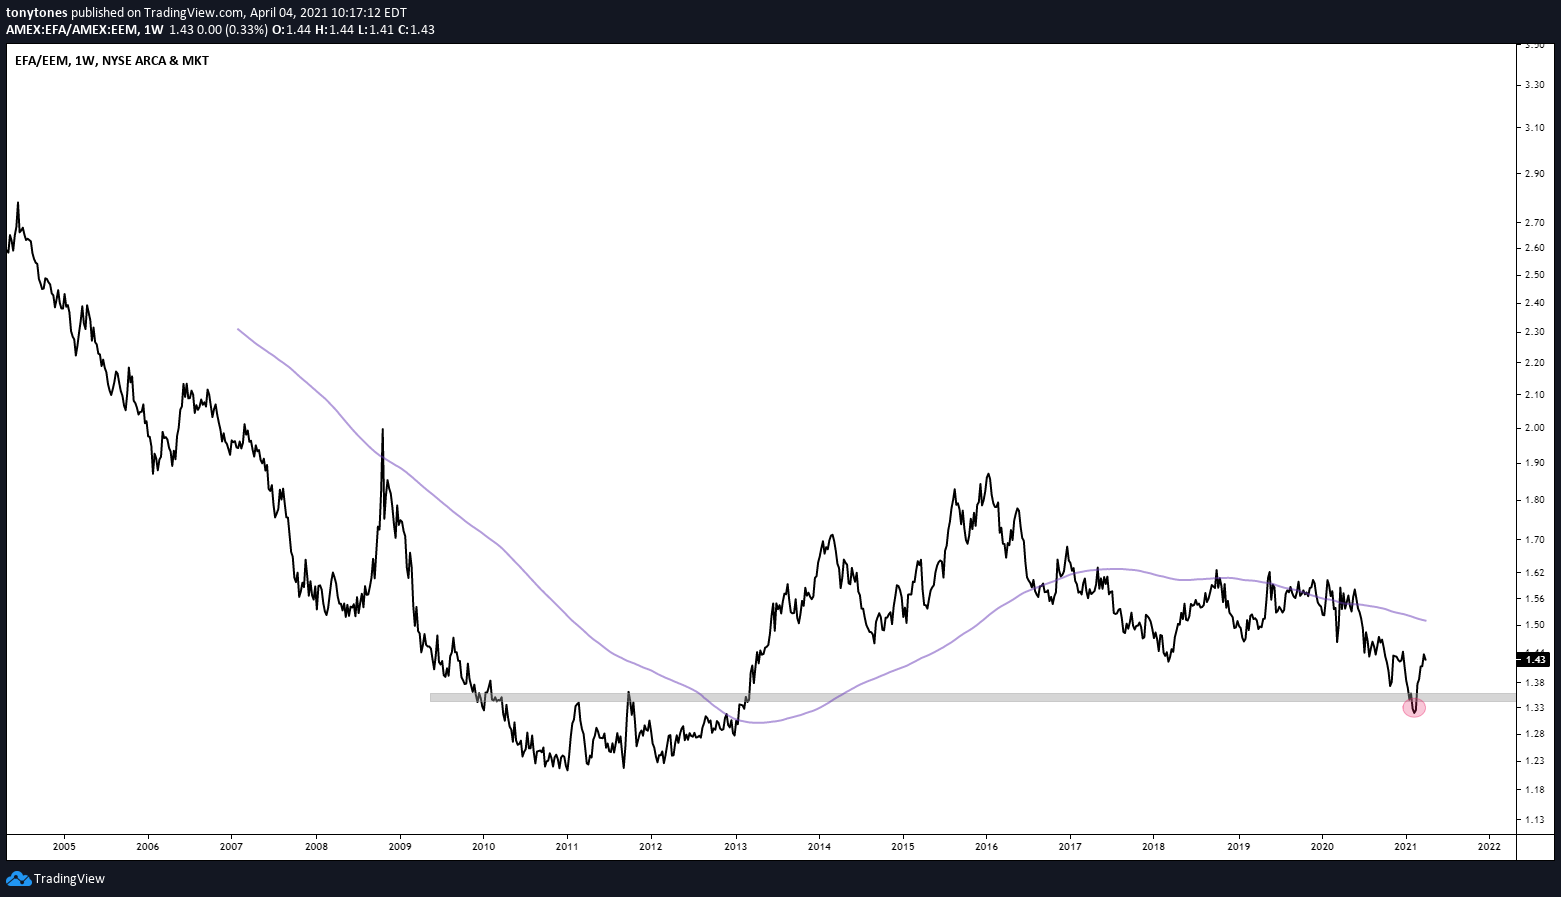
Emerging markets are still struggling with the relatively strong $DXY and a weaker China for now.
That’s all I have for this quick Easter post. Hope you all have a great day!
Cheers!