

wanderlust

Ciao, hola, kon’nichiwa, bonjour, g’day! Hope you all had a great weekend!
Since we can’t do much traveling internationally these days I decided to spend my Saturday afternoon exploring the world through some charts. Total nerd! I had fun. Leave me alone.
This will be a long one. Grab your favorite beverage!
Before we dive into the global markets, can we quickly review the prior post on rates? Here’s my closing comment from that one:
All in all, we are at interesting levels on both charts. A reversal in rates would likely be welcomed by both equity and bond bulls here.
Well a reversal we sure got! Friday’s rally in $TLT (+3.31%) was the largest one-day gain since last March (see the bottom panel of the chart). Nailed it!

Here’s the U.S. 10Y Treasury rate chart. Our 1.46% level held strong. 🎯

back to global equities
The best way I know how to track market breadth (participation) is to just look at a bunch of charts. It’s the end of February (already), so I reviewed all of the monthly charts for the countries I track to see how world’s equity markets are holding up.
The charts are broken into groups to make them easier to digest — North America, Europe, Asia, Australia, South America, Africa & the Middle East, and Australia.
The charts I typically use are called candlestick charts. One pattern that kept emerging as I reviewed the monthly charts was the shooting star pattern, which typically is a bearish one. These candles are preceded by an uptrend and look like this:

Image courtesy of Warrior Trading/Google Images
takeaway
I am putting the takeaway up here in case you don’t make it through all the charts.
The conclusion I draw is that the recent weakness in equities has been widespread across the globe. Countries like Israel, Sweden, Japan, Canada, and others look great and may just need a breather. Others look much weaker and are at critical inflection points. Many of those countries have high exposures to cyclical/value-oriented equities (financials, energy, materials, etc.) and are a major tell about the current global reflation narrative. If they can absorb recent selling and move higher we should be quite comfortable owning equities. If not, we will need to rethink a lot.
major world indices
MSCI All-Country World ETF ($ACWI): Clear uptrend with shooting star candle at key resistance and all-time highs (“ATHs”). $92.5 is the important level to hold.

MSCI EAFE ETF ($EFA): Recent uptrend with shooting star candle at the early 2018 highs. $74.74 is the important level.

MSCI Emerging Markets ETF ($EEM): Strong uptrend with nasty shooting star candle at the ATHs from 2007! Below $55.83 there is risk to $50-51 level (grey box).

MSCI BRIC ETF ($BKF): “BRIC” was a once popular term for the emergent countries of Brazil, Russia, India and China. Recent uptrend with shooting star candle key resistance. $BKF had just broke out of a 10-year base and a retest of $51-52 would be healthy.

north america
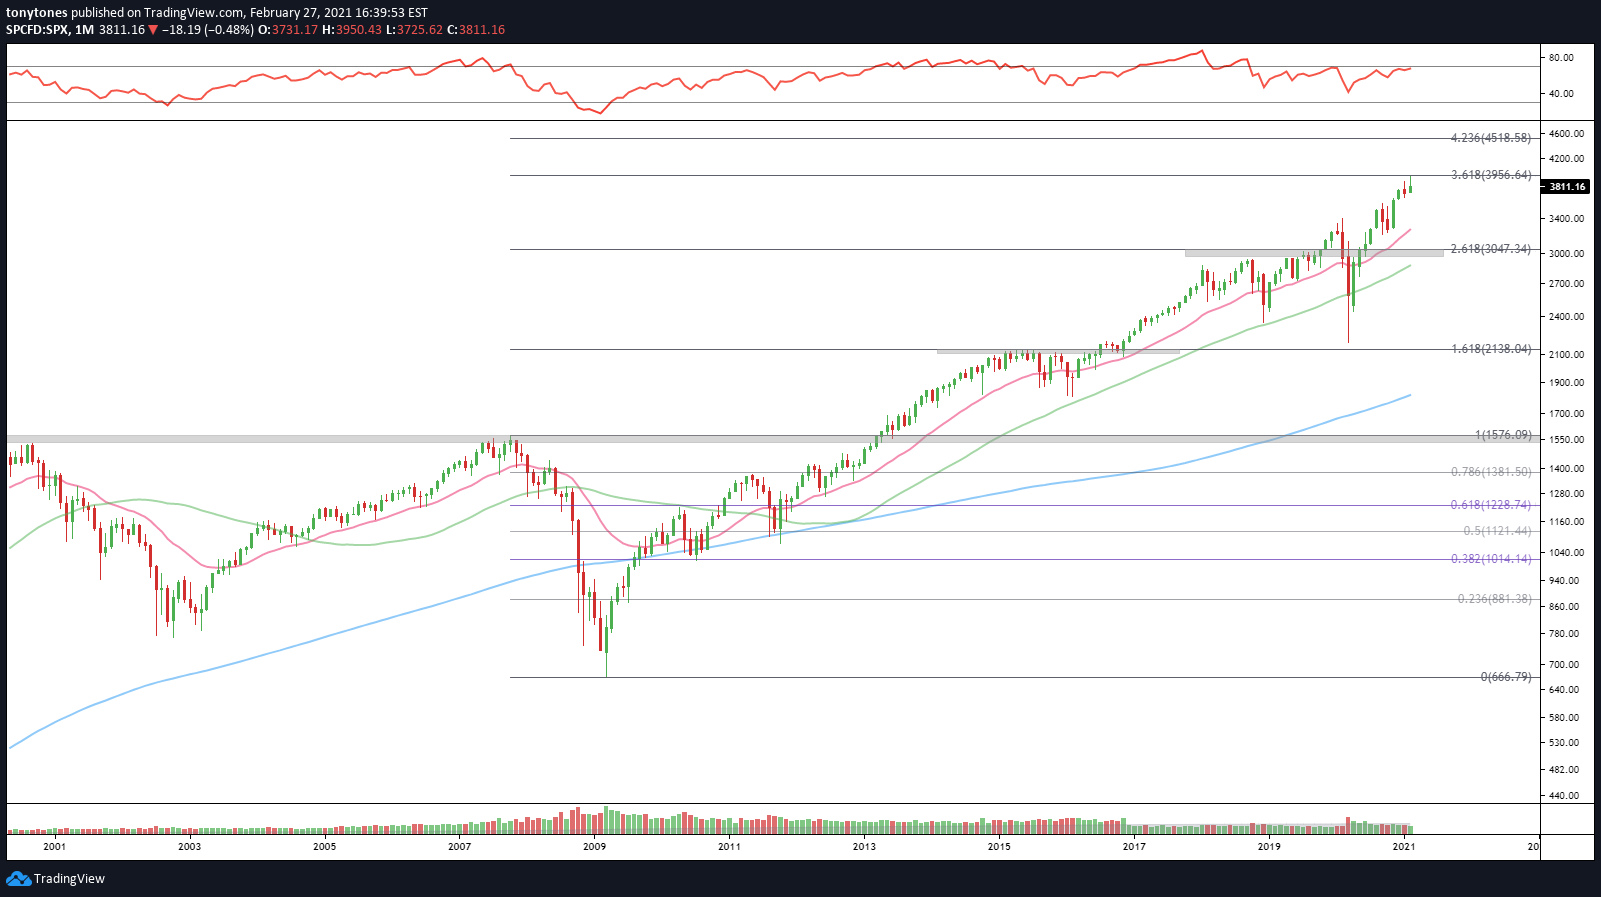
S&P 500 ($SPX): Clear uptrend with shooting star candle at our key $3,957 level from prior posts. Let’s see if it can stay positive for the year as we start March. Maybe all this market needs is a little stimmy?
Canada ($EWC): Clean breakout from a 14-year downtrend and holding above the pre-pandemic highs. One of the better looking countries, eh? $30 is the important support level.

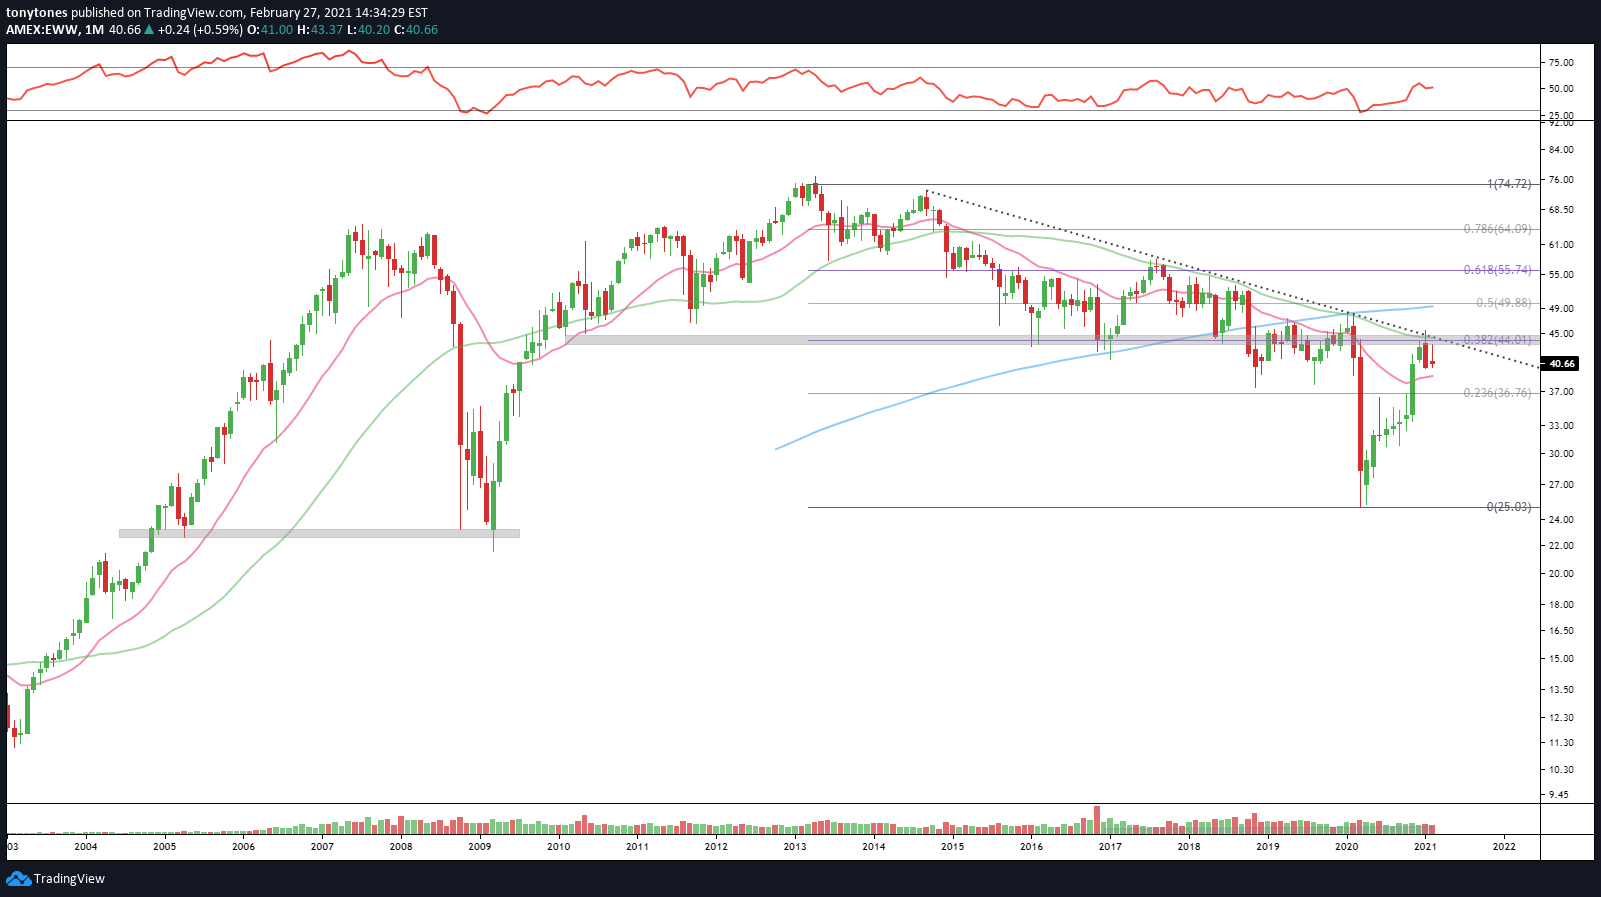
Mexico ($EWW): Clear downtrend since 2014 getting rejected again by the trendline. Avoid this one until it can really break out. Risk is to the downside.
europe
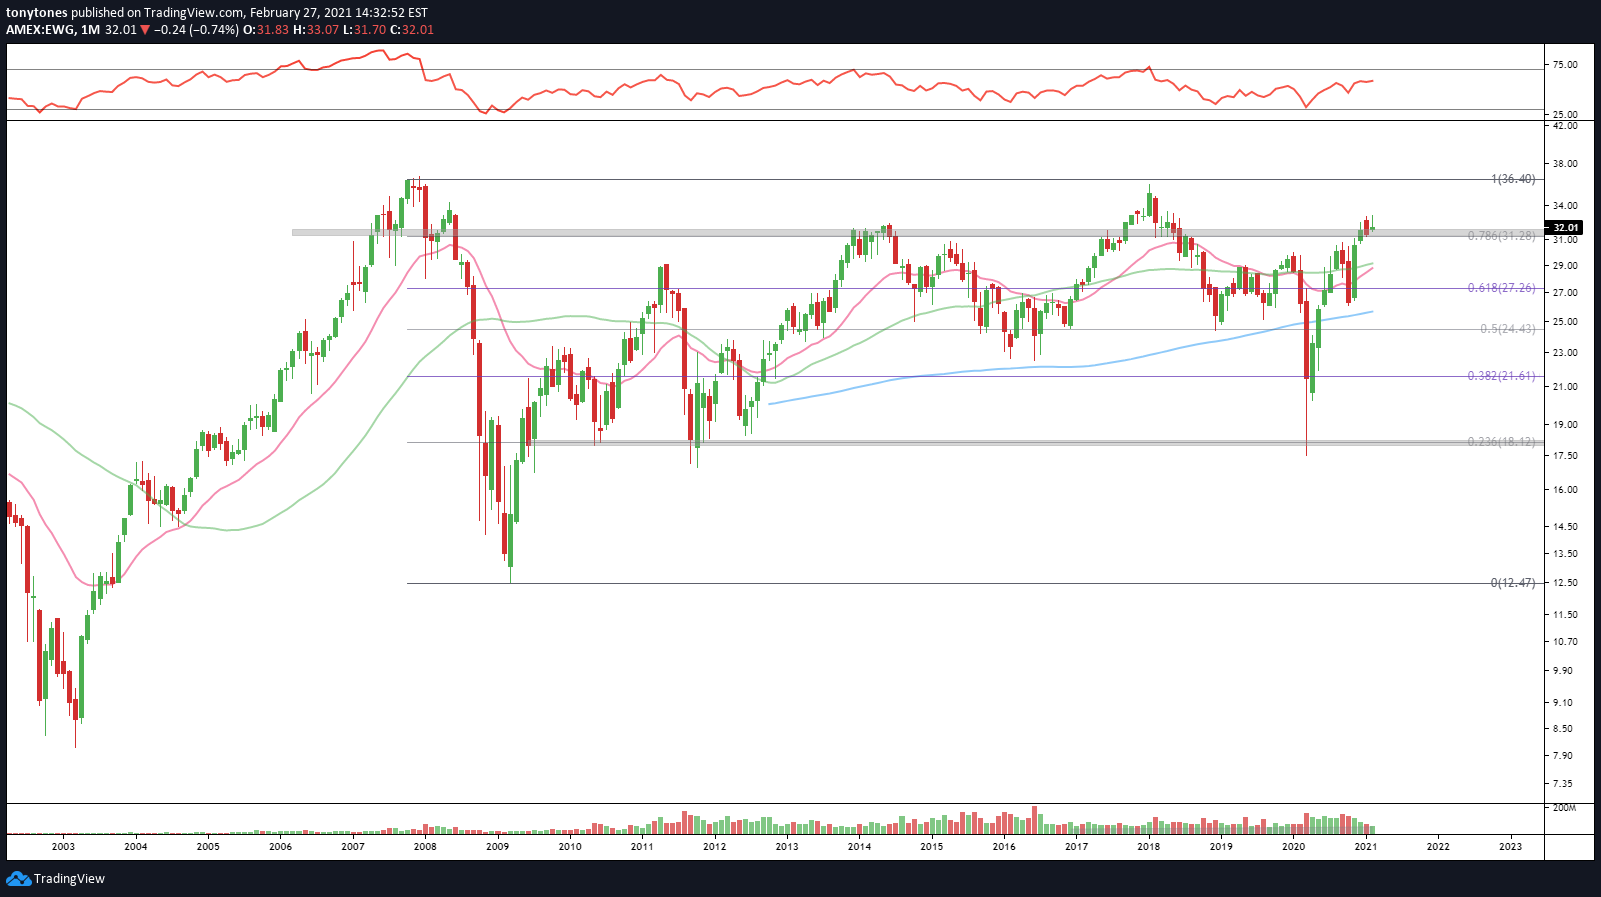
Germany ($EWG): Recent uptrend with shooting star candle above the pre-pandemic highs but below ATHs. $31.28 is the important support level.
France ($EWQ): Looks like Germany but a little better. Short-term uptrend is intact and holding the early 2018 and pre-pandemic highs. $33 is the important support level.

United Kingdom ($EWU): Clear downtrend since the Great Financial Crisis (“GFC”) in 2008 with a shooting star at key resistance of $31.88. $EWU has a big exposure to financials, energy and other cyclicals, so strength here would support the global growth narrative.

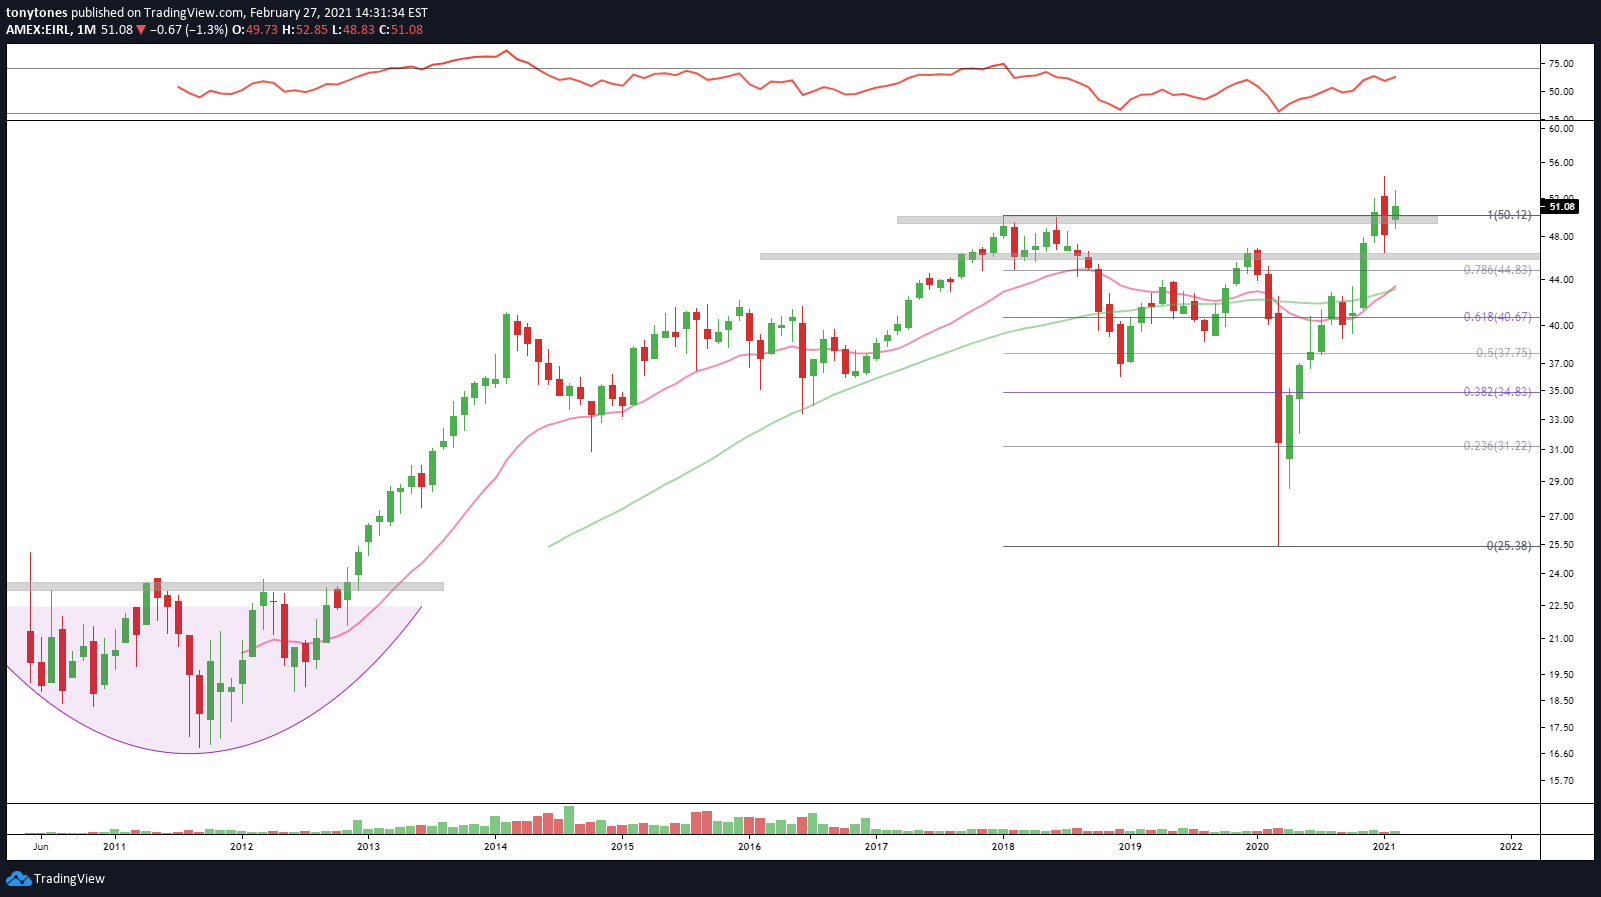
Ireland ($EIRL): Another one of the better looking ones. Go Ireland! Nice breakout to ATHs. $50 is the level to hold.
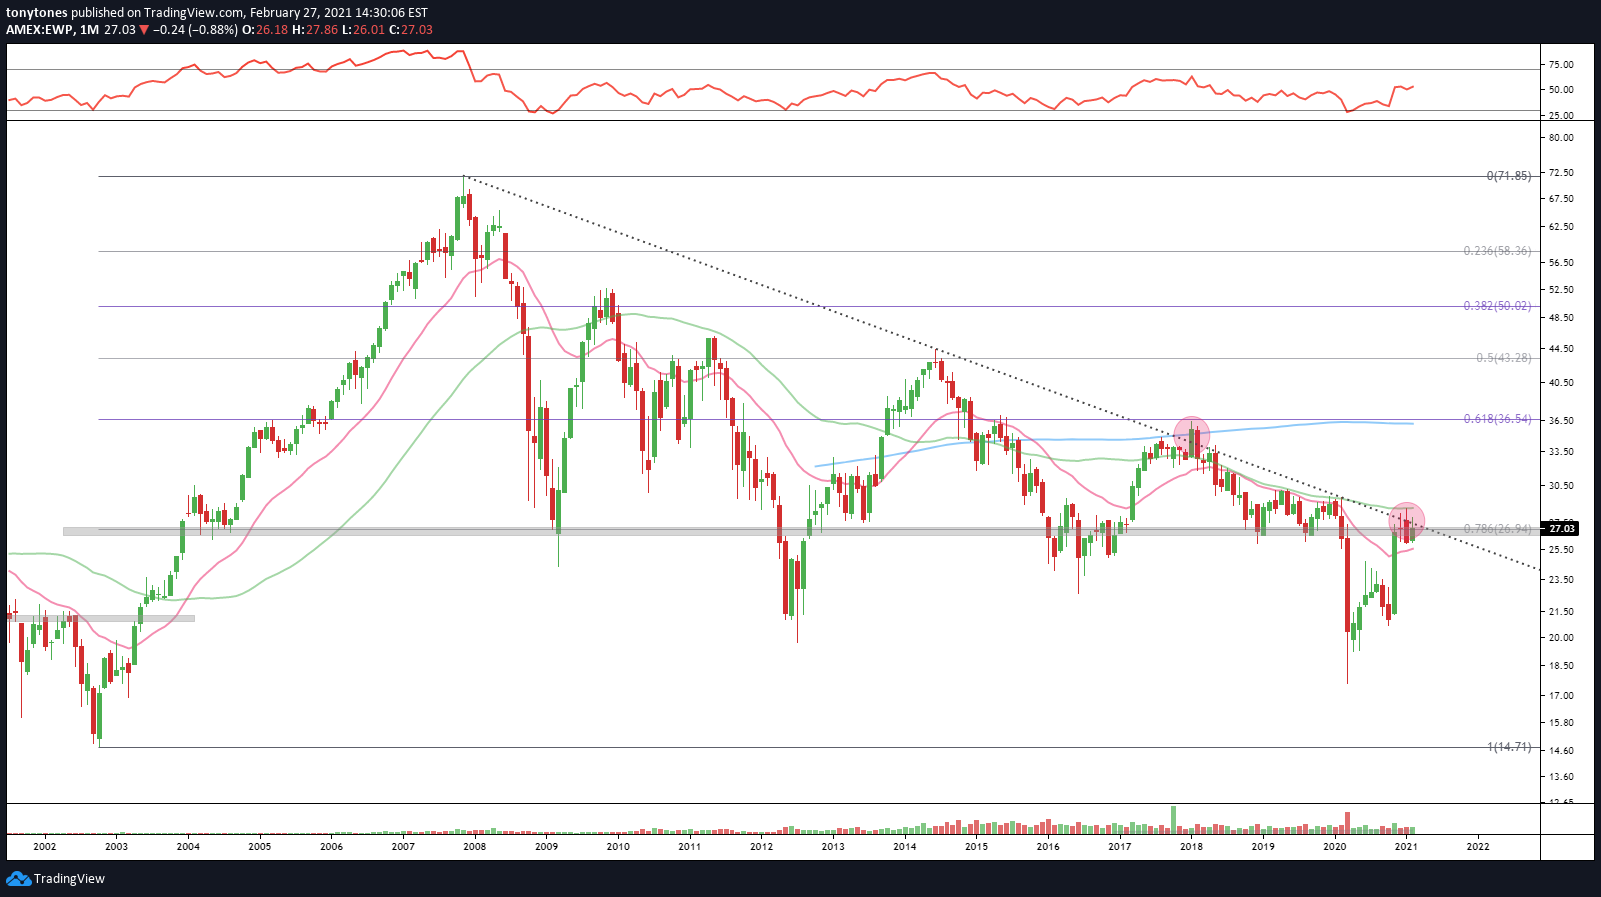
Spain ($EWP): Clear downtrend since GFC and struggling to break the trendline and hold that important $27 level. If it can breakout that would be a major change in trend for a perennial underperformer. Big “if” for now.
Portugal ($PGAL): The Iberian Peninsula looks weak all around. Clear downtrend and would need to be over $11.25 or so to get interesting.

Italy ($EWI): Clear downtrend in my favorite country since the GFC. Needs to hold $29.5 to really get started.

Russia ($ERUS): Clear downtrend since 2011 and is struggling to hold above $37.26 for the third straight month.

Poland ($EPOL): Clear downtrend since early 2011 and more recently since early 2018. Poland needs to hold it together her. A breakout through that trendline would be very positive.

Belgium ($EWK): Clear downtrend since the GFC with a shooting star at key resistance of $20.

Netherlands ($EWN): Clean breakout to ATHs but it’s putting in a shooting star near resistance at $47.

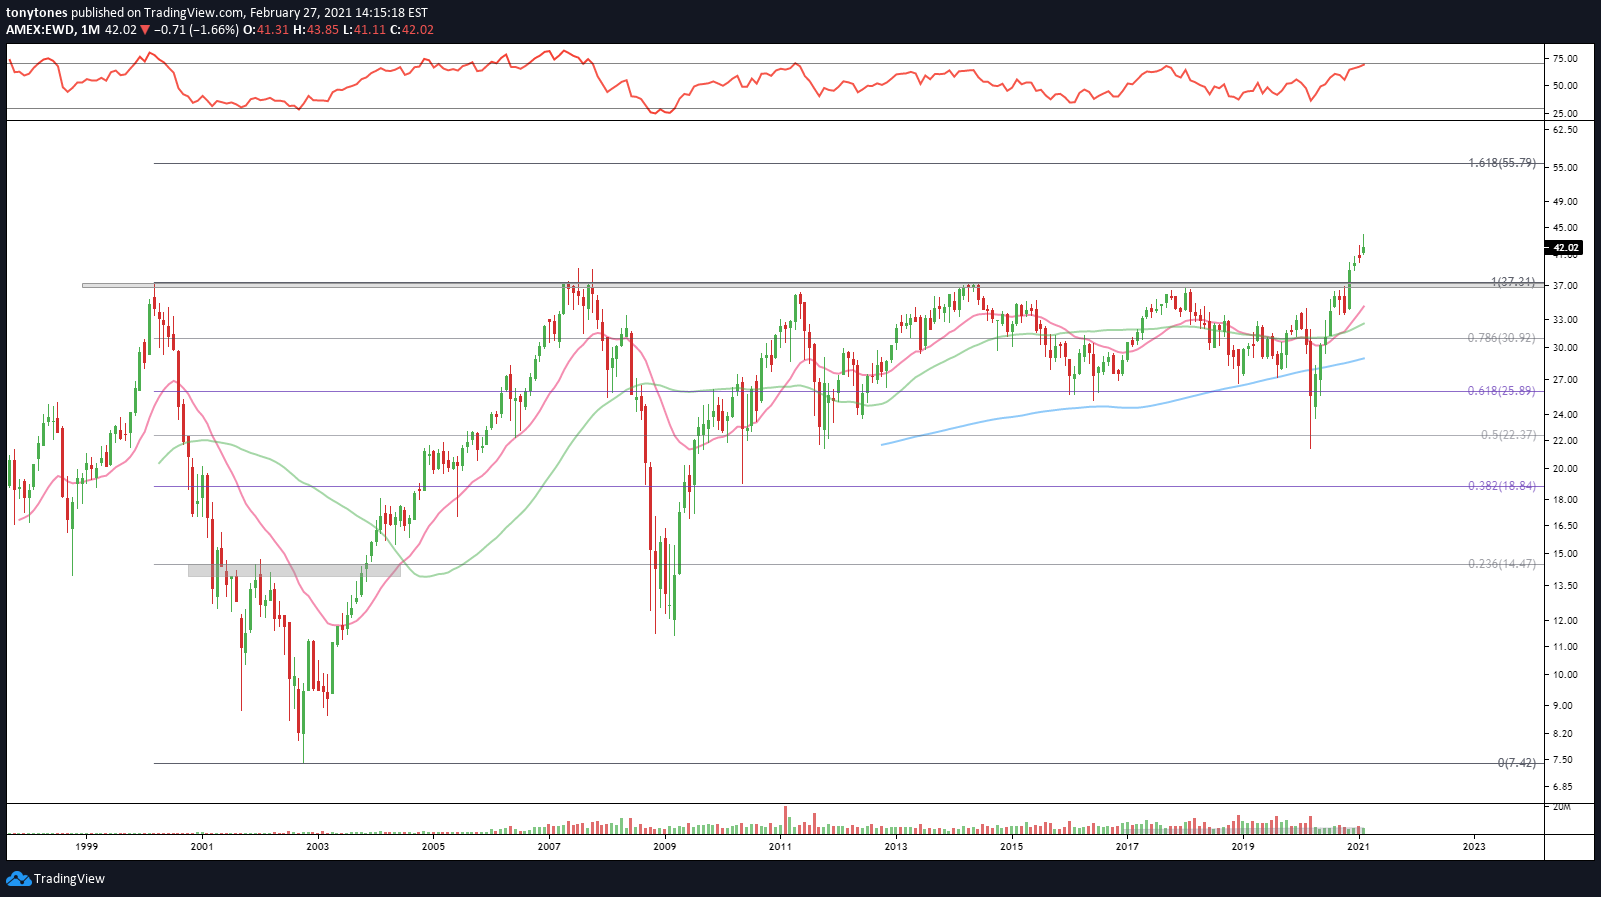
Sweden ($EWD): This is one of the better charts as well. Sweden recently broke out of a 20-year base from the early 2000’s and looks good as long as its above $37.3.
Switzerland ($EWL): Strong uptrend meeting recent weakness. Important support is near $37 and upside is to $51.79.

Denmark ($EDEN): Another strong uptrend in Denmark met with selling at key resistance near $100 ATHs. Downside risk is to $81.29.

Austria ($EWO): Clear downtrend since the GFC with a shooting star candle at resistance of $21.61.

Finland ($EFNL): What is there to dislike here? Clear breakout to ATHs above the early 2018 highs albeit with some recent selling. Important support is near $43.56.

asia
China Large Caps ($FXI): Talk about a chart that looked super promising a couple weeks ago. $FXI was putting in 12-year highs before tumbling back below $52.62 resistance.

China A-Shares (ASHR): Oof. This monthly candle is just brutal. Massive shooting star closing below the 0.618 retracement at $41.96.

Japan ($EWJ): Talk about a big base! Japanese equities have gone nowhere for over 20 years. Is this time different? $66.25 is the important support level.

Taiwan ($EWT): What a beast Taiwan has been. Some weakness into the end of the month but all arguably the strongest country post-pandemic. Look to $50.93 as the key support if things get dicey.

South Korea ($EWY): Another clean breakout to ATHs. South Korea has been weak the last two months but looks good on a relative basis. $75 is the important support level.

India ($INDA): India is clearly one of the better charts from a trend standpoint but the shooting star may warrant a breather. Holding prior ATHs is key.

India 50 ($INDY): Similar story as the broader India ETF above. Nice breakout with $39.29 as critical support below.

Hong Kong ($EWH): Hong Kong is building quite the base since GFC but failed at its recent attempt to take out its 2019 highs. Support is near $24.3.

Thailand ($THD): Another one getting sold at resistance for two straight months. Risk is to the downside below $80.35.

Malaysia ($EWM): Looks weaker than Thailand but overall a similar story. Needs above $28.66.

Indonesia ($EIDO): Clear downtrend and quite weak. Indonesia needs to stay above $22 before it gets ugly.

Philippines ($EPHE): Same story as Indonesia above. The $29-30 level is critical.

Vietnam ($VNM): Vietnam has been in a perpetual downtrend since this ETF was created but it has a simple level to trade against here. A breakout from that trendline would be a major change of trend. Below $16-17 could get quite ugly.

Singapore ($EWS): Another consistent downtrend since GFC and more recently since early 2018. No breakout here yet and still failing to push through through old support from 2019.

south america
Brazil ($EWZ): Clear downtrend since the GFC and can’t seem to reclaim the lows of 2019. Needs to hold these levels or things can get really ugly here.

Chile ($ECH): Clear downtrend since 2010 with a shooting star at resistance at $32.35. This is another country with a huge commodity and cyclical exposure, so it is important for the global growth narrative.

Peru ($EPU): Clear downtrend since early 2011 and big failure at resistance at $38.49.

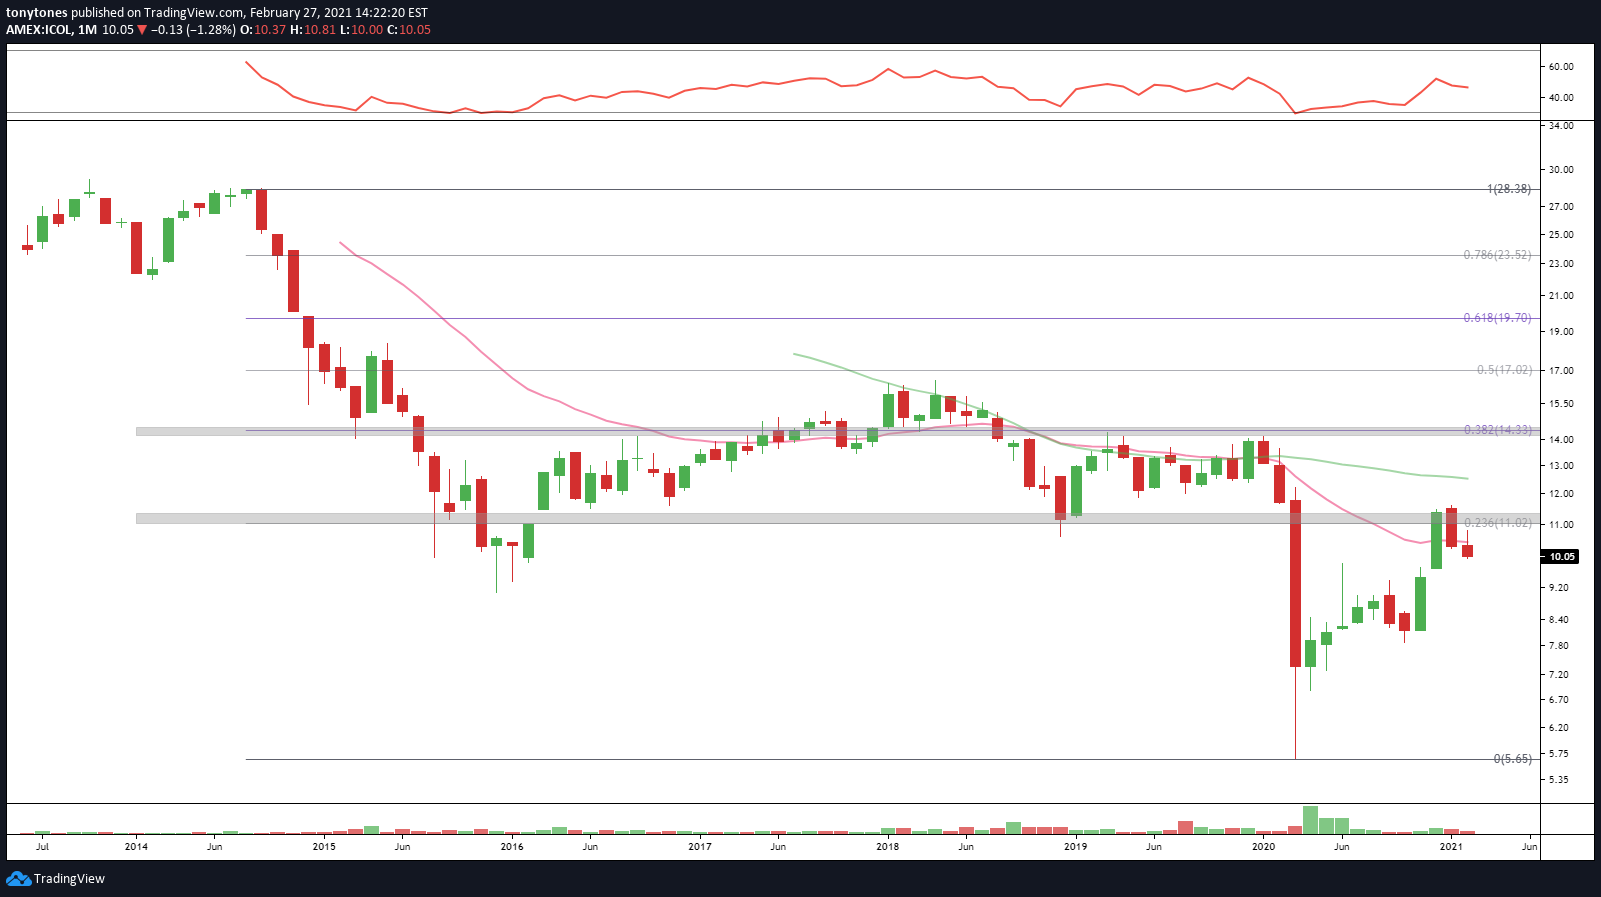
Colombia ($ICOL): Colombia has been in a downtrend since the ETF’s inception and found supply at resistance of $11. Nothing to do below there.
africa & the middle east
Israel ($EIS): Israel has one of the better looking charts albeit with some recent weakness. It just broke out from an 11-year base to ATHs. Support sits near $61.79.

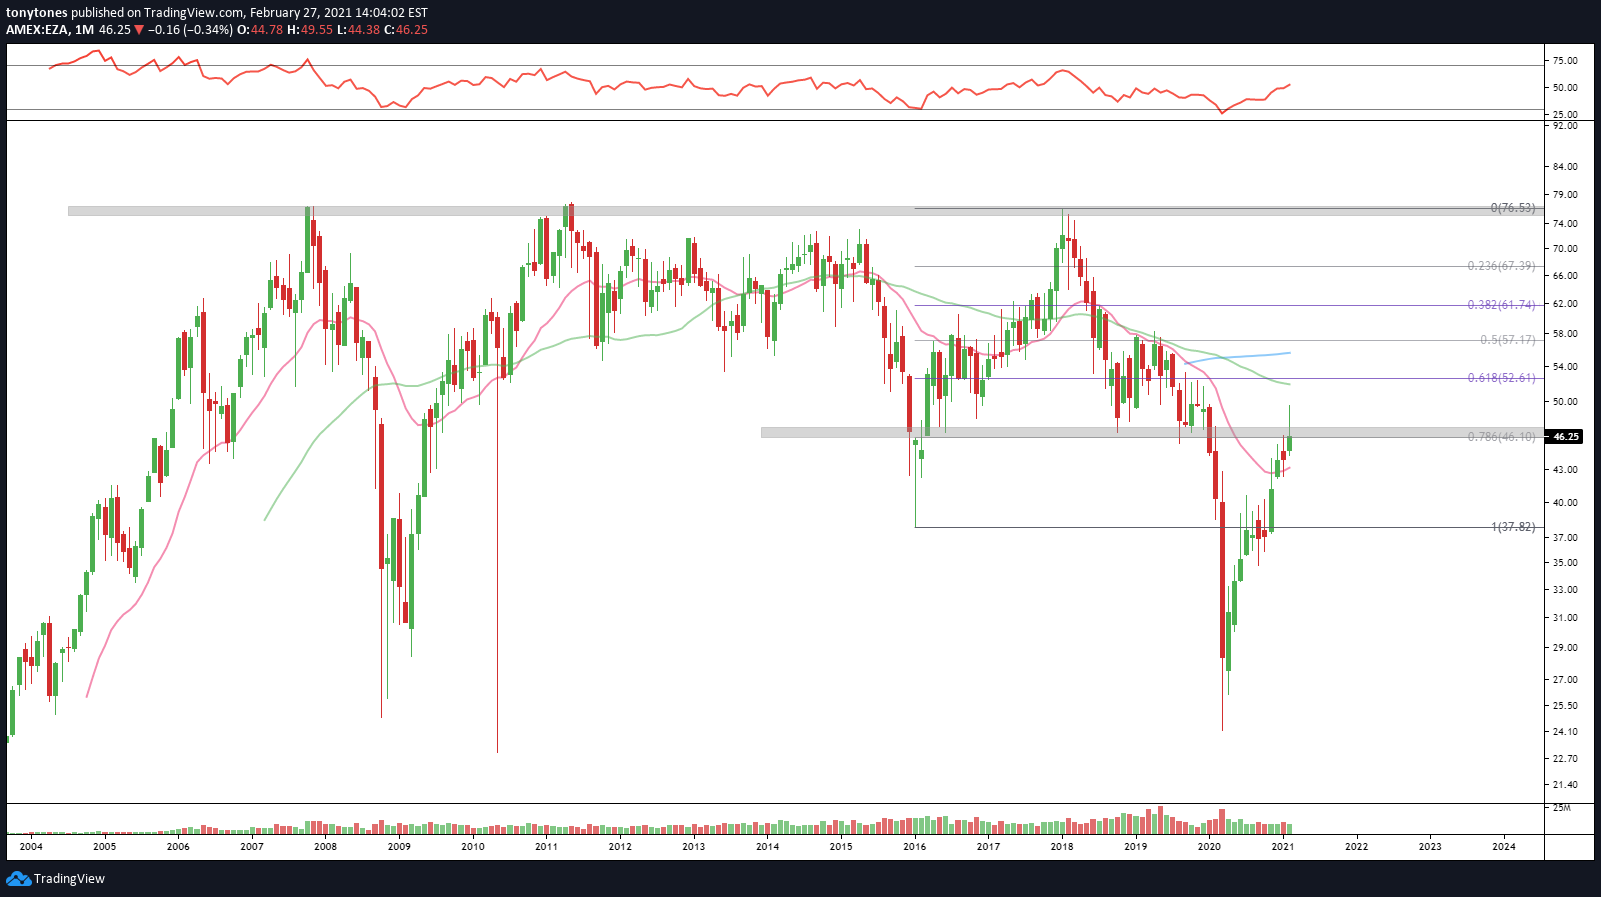
South Africa ($EZA): Another shooting star at resistance from the 2019 lows near $46.10. Risk is to $37.82 below there.
Turkey ($TUR): Eek. Major downtrend since 2013 and a big reversal at resistance near pre-pandemic highs. Below $29 is ugly.

Saudi Arabia ($KSA): Saudi Arabia looks more constructive than the UAE and Qatar above pre-pandemic highs but needs to hold that $30-31 level. Another country heavily weighted towards energy, financials and materials.

Qatar ($QAT): Another clear downtrend since the ETF’s inception struggling with those pre-pandemic highs around $18.

United Arab Emirates ($UAE): Clear downtrend since this ETF’s inception and putting in a shooting star at resistance from the old lows. Needs to clear $13.5 before it gets interesting.

australia
Australia ($EWA): Australia looks quite similar to Canada, another country with a heavy exposure to commodities. It’s breaking the downtrend in place since the GFC but put in a shooting star at key resistance near $25.5.

New Zealand ($ENZL): Nice, strong uptrend with a swift reversal at key support around $63.6, needs to reclaim that level to keep the party going.

Did you make it all the way through? If so, congrats! You know what’s going on across global equities.
Thanks for reading! Please feel free to share with anyone you think may be interested in my work.
Cheers!