

hindsight

Happy President’s Day, friends! Remember me? It’s been a few weeks since my last post and the markets are closed today, so it’s the perfect time to relax, reflect and review some charts!
I figured, given the brief hiatus between posts (my apologies), it would be helpful to review some of the previous ones to see how our views have held up and then decide whether anything major has changed since.
before we dive in
I’d like to take a quick second before we review prior posts to let everyone know what I have been working on since my last post. Many of you have emailed, texted and called me with questions and making requests and I am glad to accommodate. Here is a list of some of content I am working on:
How to interpret the charts/Technical Analysis 101
How I look for stocks to trade/idea generation
What I am trading/setups I like
reviewing prior posts
January 9th: “numero uno”
The takeaway from my first post in early January was, “Autopilot, for now.”
The overall trend in risk assets is positive, albeit somewhat overbought. As it stands today, pullbacks and consolidations would be welcomed as the markets digest their recent gains.
Let’s take a second to review my market commentary, one asset class at a time.
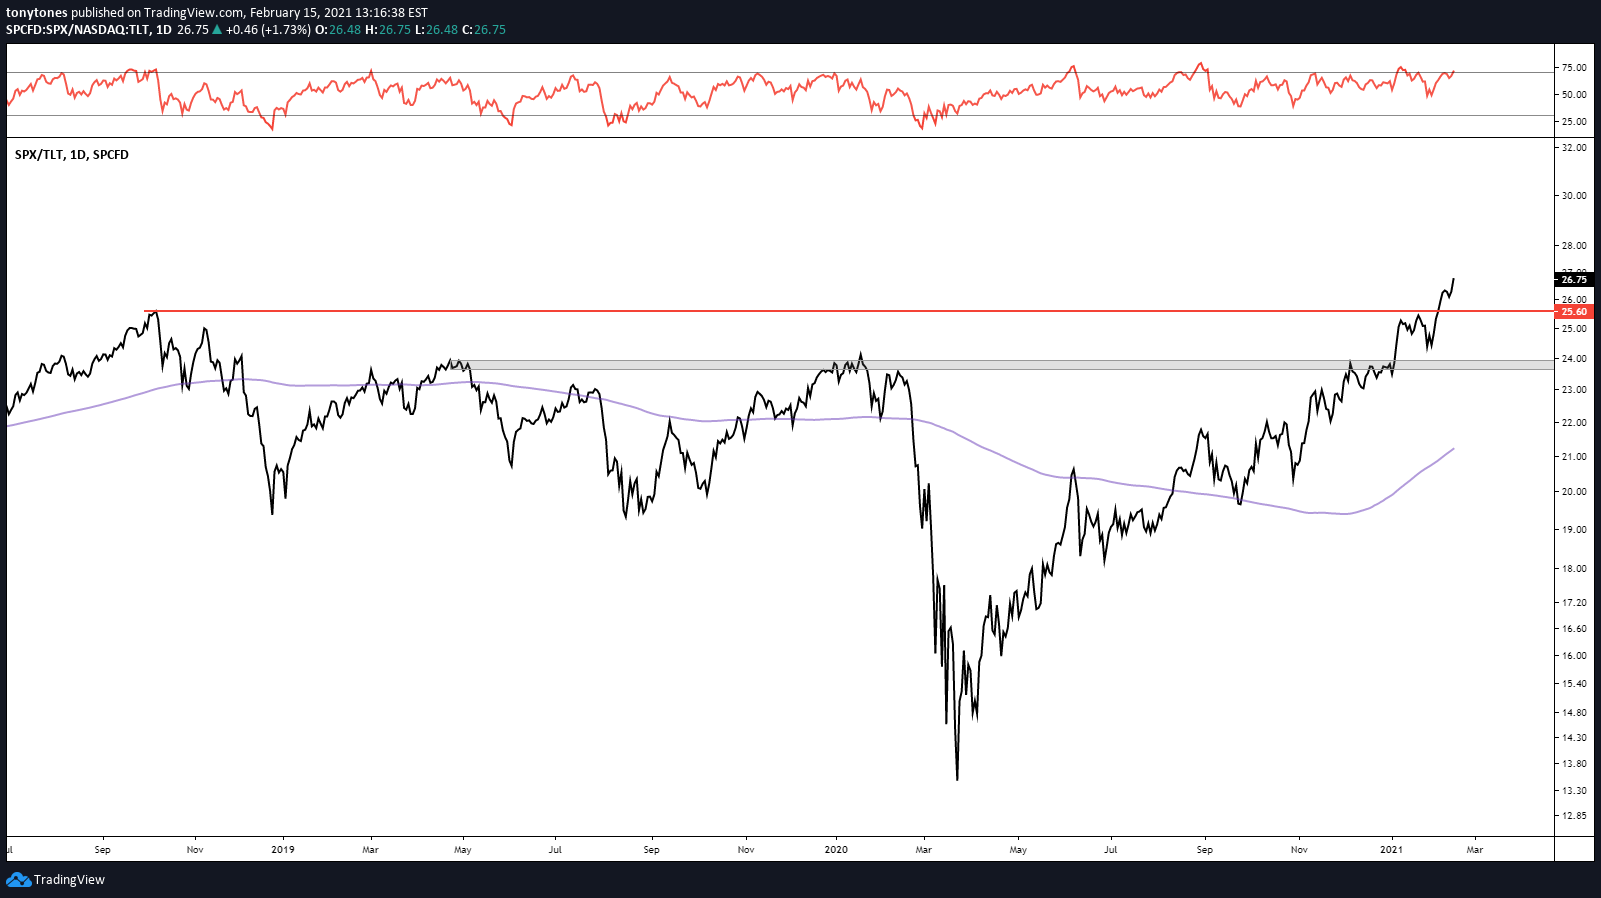
Equities were the preferred asset class
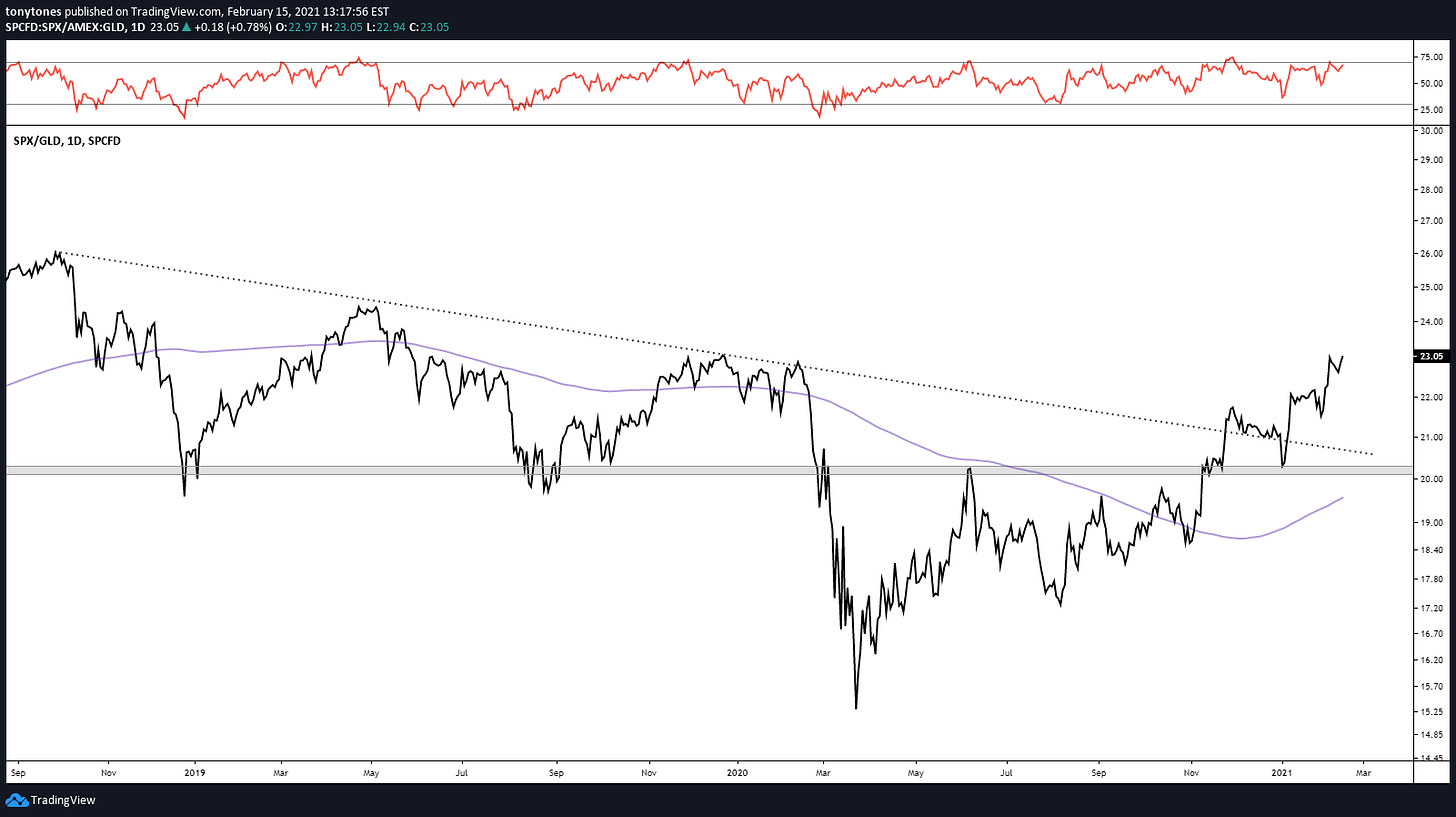
Equities were attractive relative to bonds ($TLT) & gold ($GLD). No change in trend here and $SPX is at new all-time highs relative $TLT.

$SPX was targeting $3,957 next. Almost there!

$EFA & $EEM looked attractive on an absolute and relative basis. Both are at or approaching all-time highs.


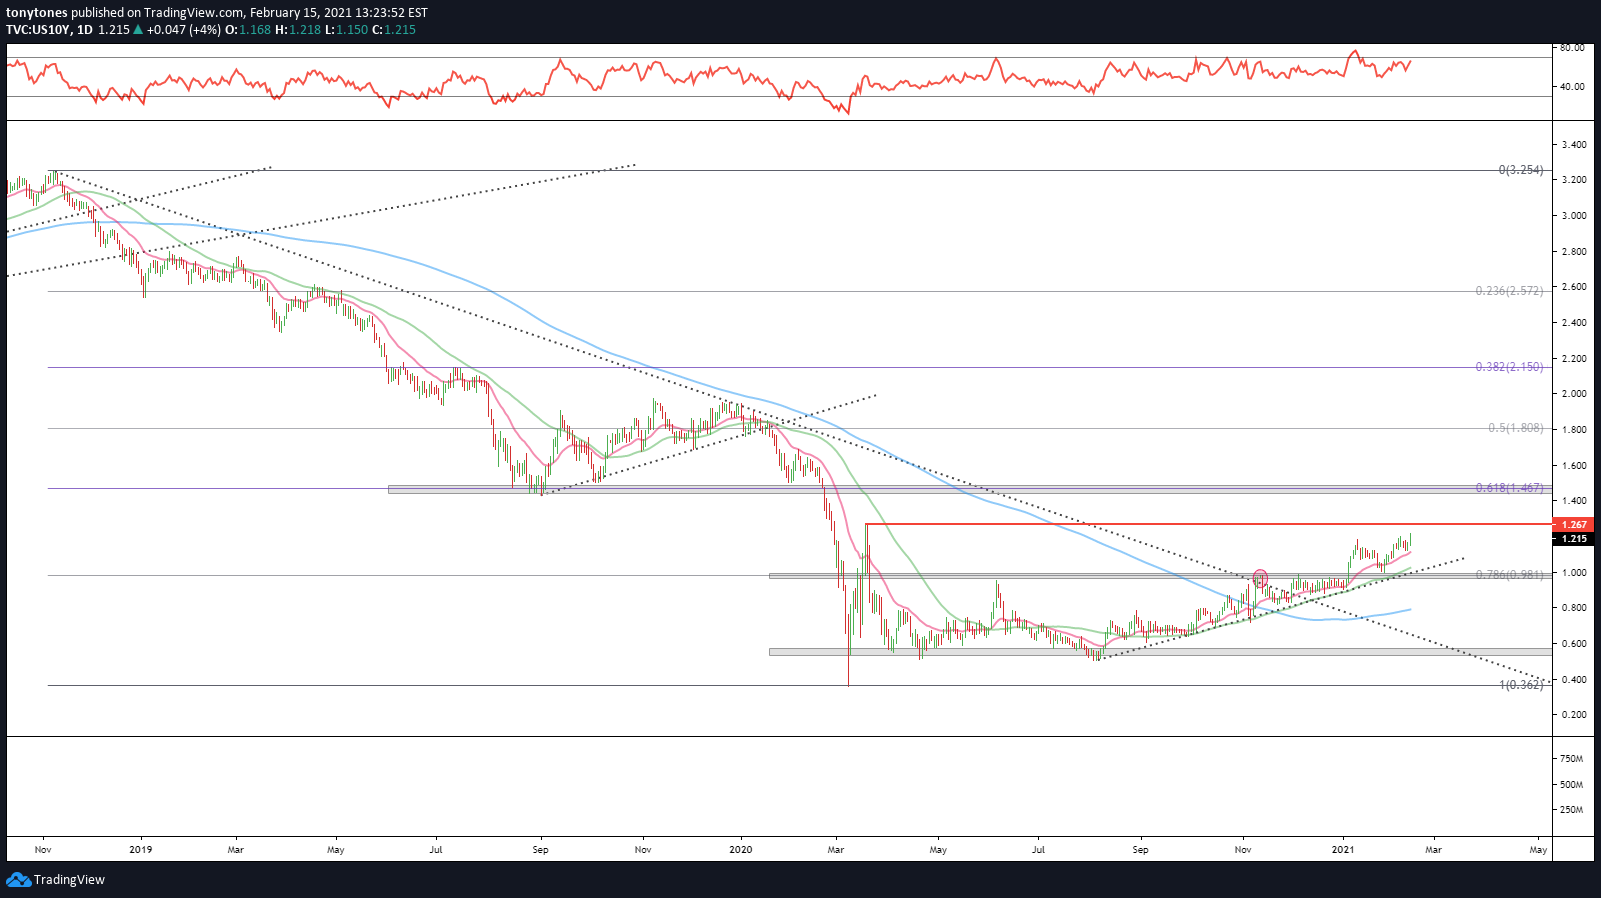
Fixed income (bonds) generally looked bearish, which meant higher rates and lower bond prices
Higher rates ($US10Y, $TLT) and expected inflation ($TIP/$IEF). Bonds are breaking down decisively and inflation-protected securities ($TIP) continue to outperform.


Steepening yield curve
Credit ($HYG) over safe havens ($LQD, $IEI). The trend continues.


Commodities were strong and attempting a breakout
$TRJEFFCRB looked bullish above $166.6 to test the long-term downtrend. Breakout confirmed.

$CL1! looked bullish and was targeting $60/barrel. Nailed it.

$HG1! looked bullish above $3.613 and was targeting $4. Well on its way.

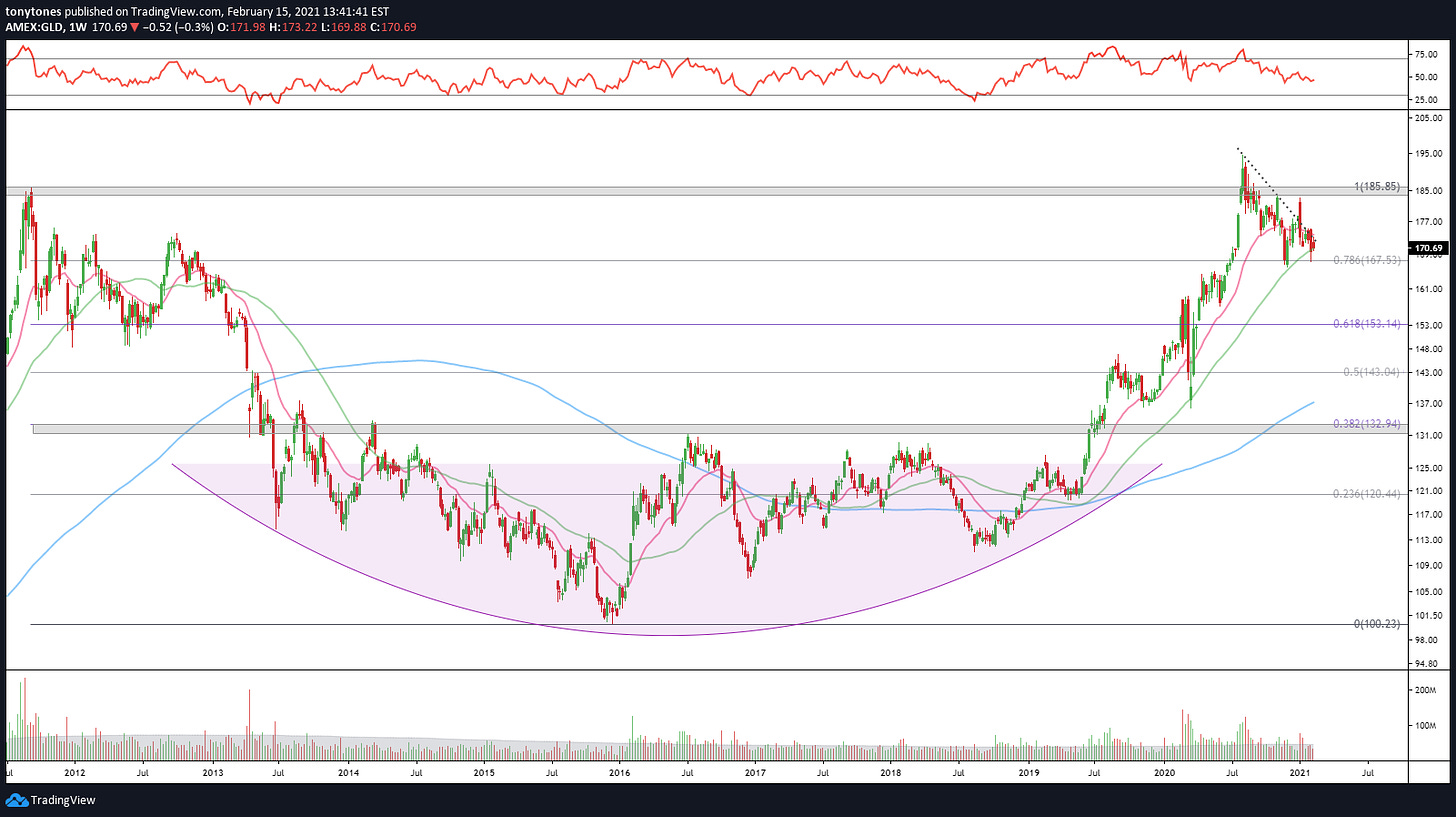
$GLD was worth avoiding within the current range, similar story for $SLV. Chop, chop, chop. Still.

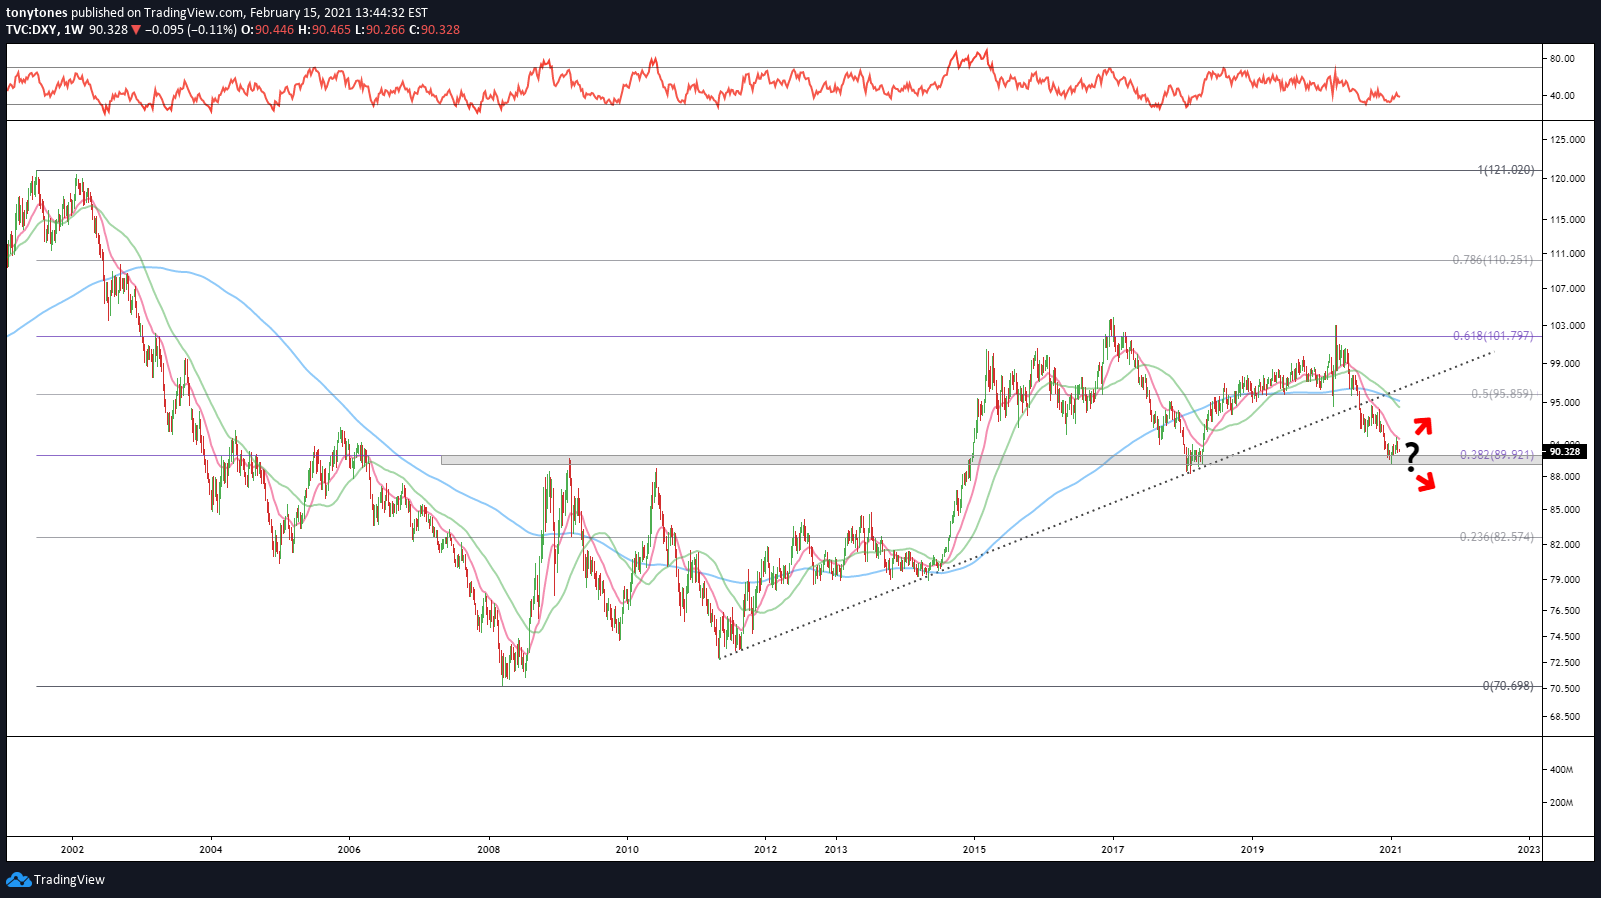
Currencies
$DXY had decent support for a short-term reversal at $89.921, although it appeared to still be in a longer-term downtrend. Nothing changed here, yet.

Other $DXY basket currencies ($EURUSD, $GBPUSD, $USDCAD, $USDSEK) were generally attractive versus the USD. Check, check, check, check.
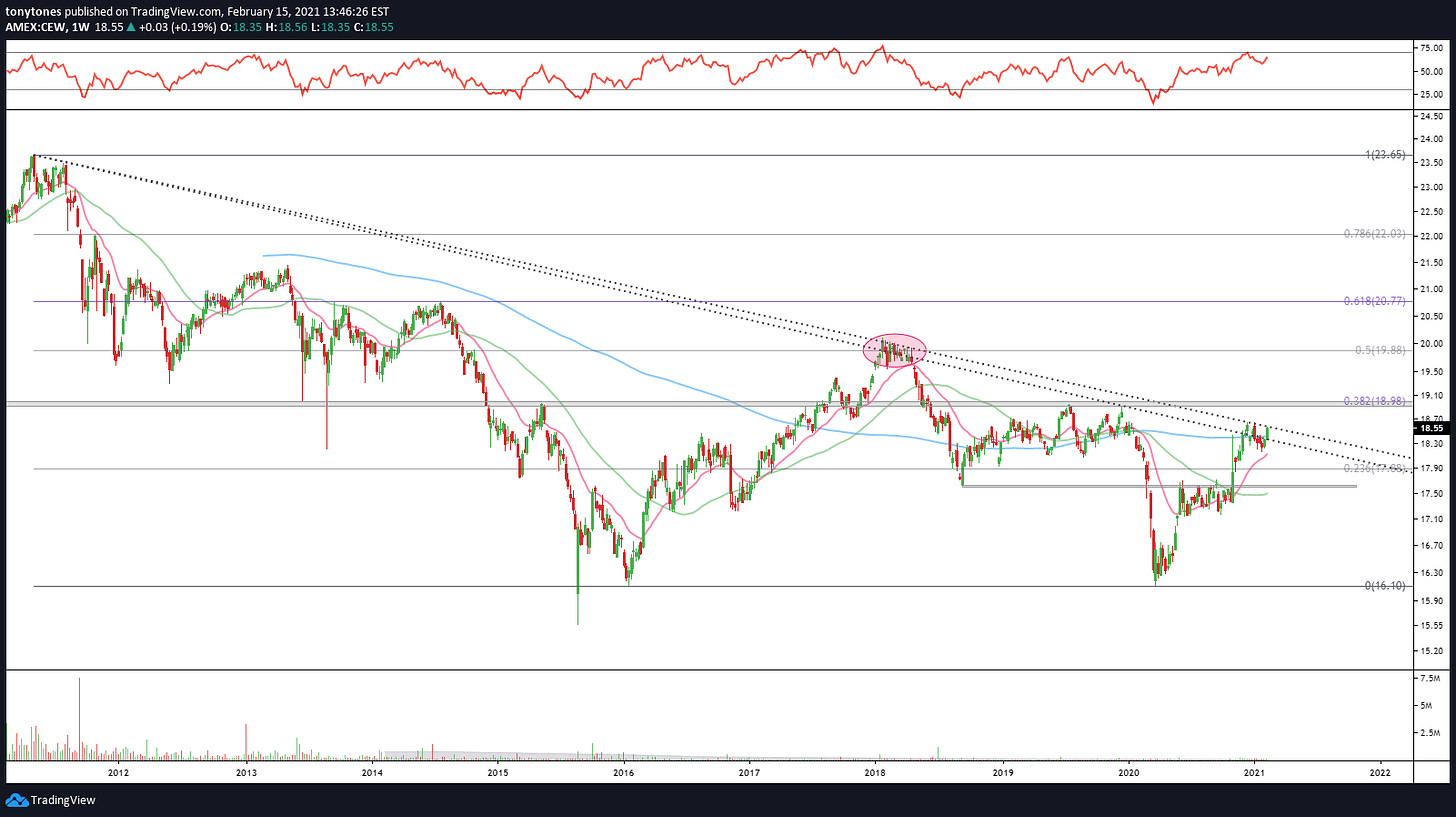
$CEW was breaking out of a long-term downtrend with $19 a key level. Working on it.
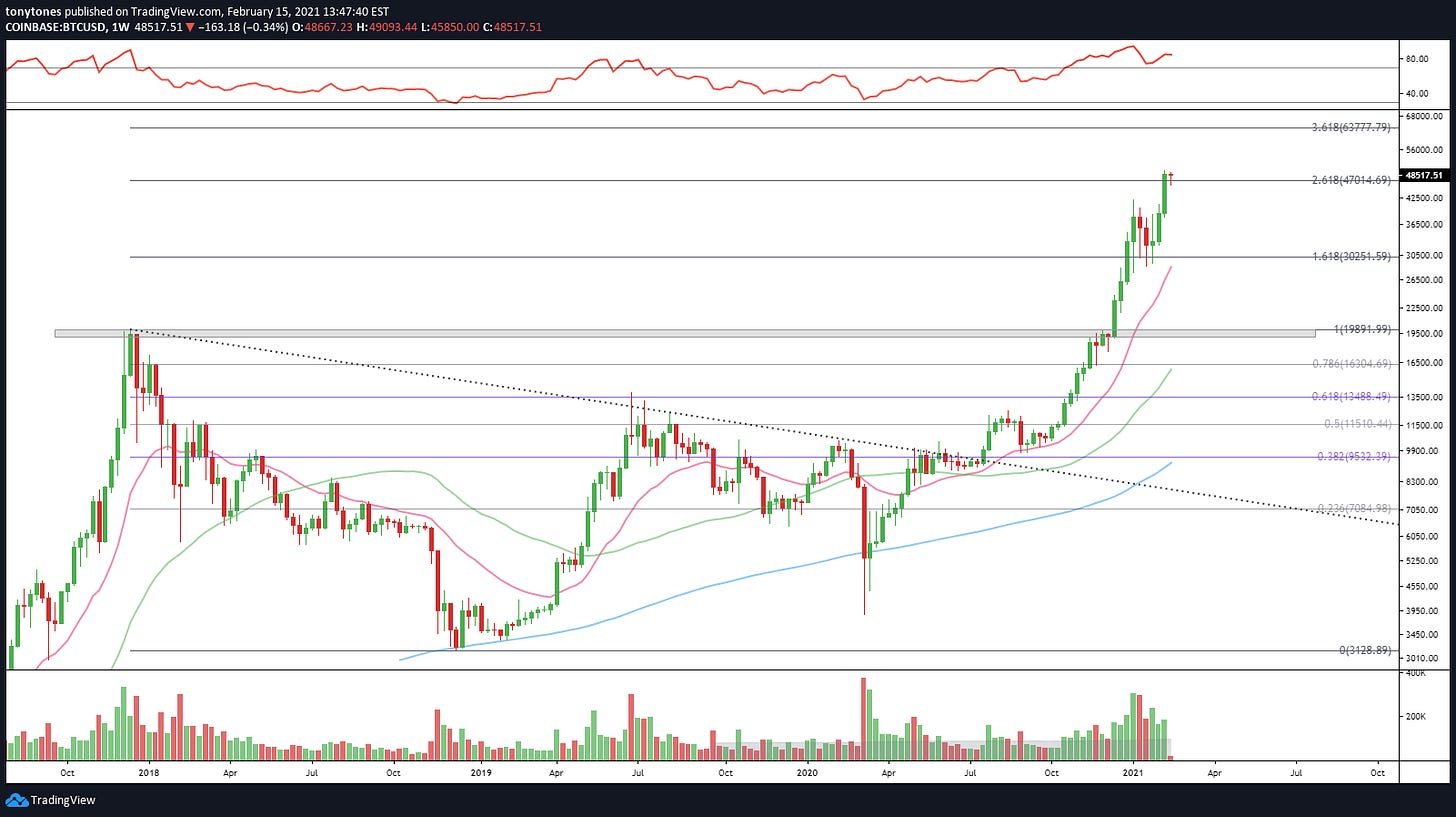
Cryptocurrencies had a bullish bias with volatility expected.
$BTCUSD had support at $30.25K and was targeting $47K. That $30.25K level held up multiple times. Are we ready for $63.8K Bitcoin? Watch $47K for support.
$ETHUSD was targeting $1,420 with a new target of $2,248 on a sustained breakout. Fresh air to move higher.


January 18th: “troops leading the generals”
The takeaway from this post was relatively straight forward:
Relative underperformance of the generals isn’t a bad thing when we see broader market participation, known as breadth, by the troops. By “the troops,” I am referring to the smaller stocks that are typically more sensitive to risks in the economy. The charts indicate that market participants are willing to buy the riskier segments of the market over the typically safer, more stable Generals. To me, this indicates higher risk sentiment.
So far, so good! Let’s review a few of the charts from that post before moving on.
Russell Mid-Caps ($IWR) versus S&P 500 ($SPY):

Russell 2000 Small-Caps ($IWM) versus S&P 500 ($SPY):

Micro-Caps ($IWC) versus S&P 500 ($SPY):

January 26th: “i was wrong”
I don’t have much to say about this post. It was a fun post about sentiment, short-squeezes, and risk-seeking behavior — an incredible, albeit short-lived, phenomena in the now legendary saga of GameStop. Here’s the chart with hindsight as our friend.
GameStop ($GME):

+18,693% run from the pandemic lows to a -89% fall from the highs. That was fun. Hope nobody got too hurt.
January 27th: “caution”
The takeaway from my most recent post in late January was one of short-term caution. The major indices were pulling back during the GameStop episode and I outlined potential levels of support to watch before we could become more concerned.
Fortunately for everyone except the #WallStreetBets diamond hands, the indices all held those levels and many resumed their uptrends towards all-time highs. The U.S. 10-Year Treasury Rate ($US10Y) has also resumed higher after a brief pullback.
Volatility Index ($VIX): It is probably worth noting that the $VIX managed to retrace back from the high $30’s back down to $20 on Friday.

looking back and forward
Ok. So we reviewed the meat of the last few posts. Hindsight is 20/20 but our foresight wasn’t too bad either. The majority of the forecasts held up quite well and we managed to stick with the larger trend. Technical analysis is cool, right?
So what’s the next? IMO, there is little reason to change the playbook. I’ll dive into some more granular analysis in the next few days for everyone. There’s plenty going on below the surface. I really like those commodity charts…
As always, please reach out to me with any questions, comments or other feedback.