

caution

Today was one of the more interesting trading days in a while. The dichotomy of the market beneath the hood couldn’t have been more glaring. The S&P 500 ($SPX) and the NASDAQ ($NDX) tumbled 2.57% and 2.80%, respectively. Meanwhile, the new meme stocks — GameStop $GME, AMC Entertainment ($AMC), BlackBerry ($BB), Koss Corp. ($KOSS), Express ($EXPR), Build-A-Bear ($BBW), Fossil ($FOSL), etc. — rallied to incredible heights.
Side note, it is quite hilarious to see where the squeezes are occurring. Imagine getting your fund blown up by some Reddit kids pumping f’ing Build-A-Bear? Sad. Who runs risk management at these shops?
I think it would helpful to look under the hood to analyze the stark divergence that is beginning to develop. One technical aspect to consider is whether the weakness in stocks is due to funds having to sell their favorite stocks to cover their losses on the highly-shorted ones. Not sure that is the case but the possibility came to mind. Let’s take a look.
the major indices
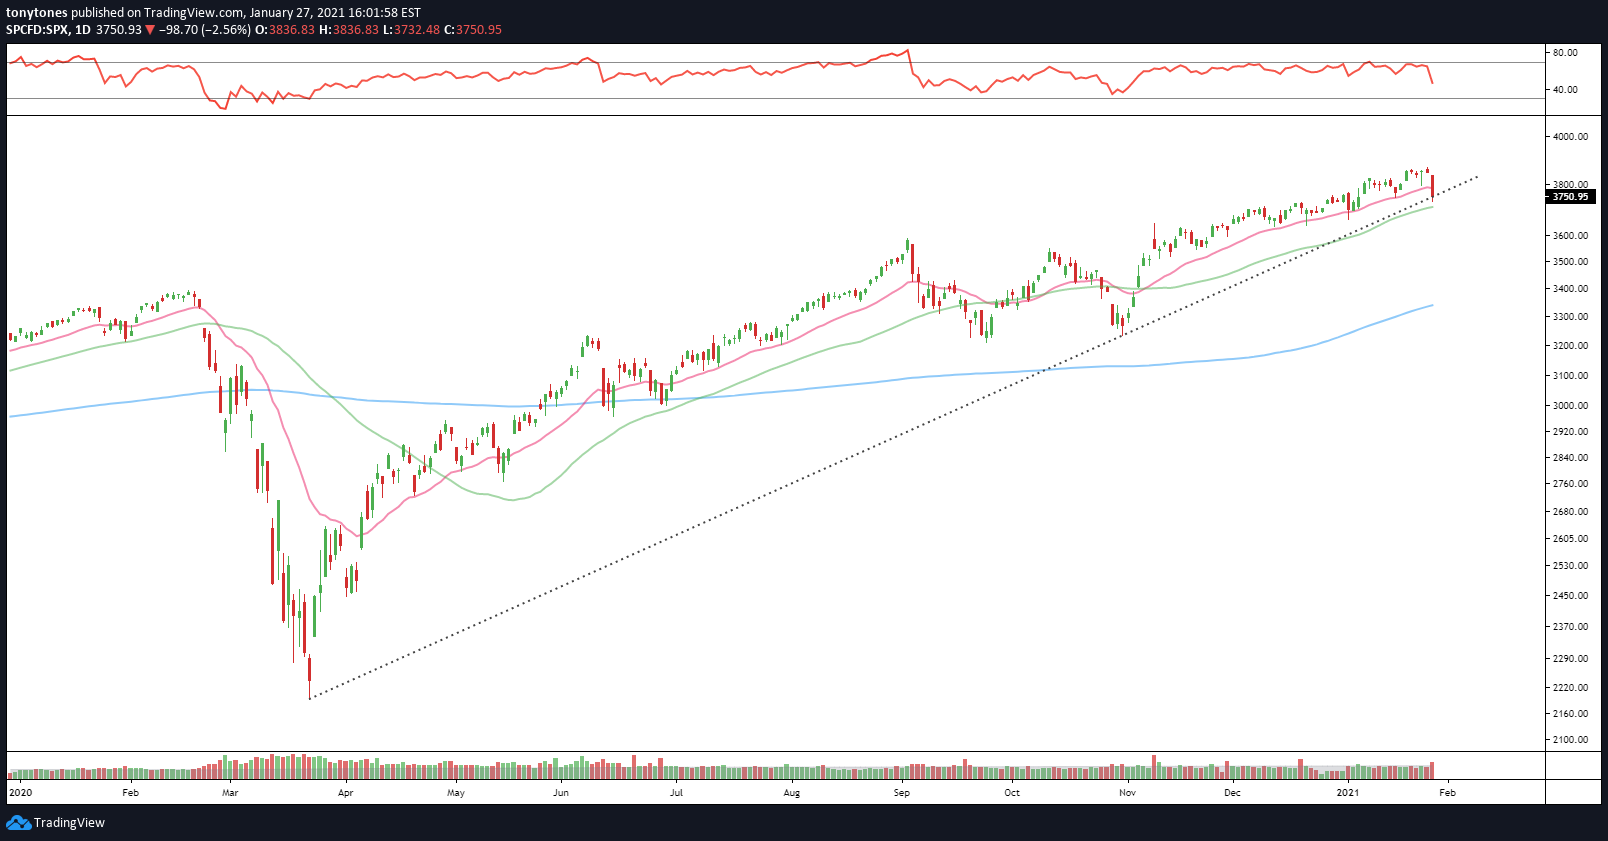
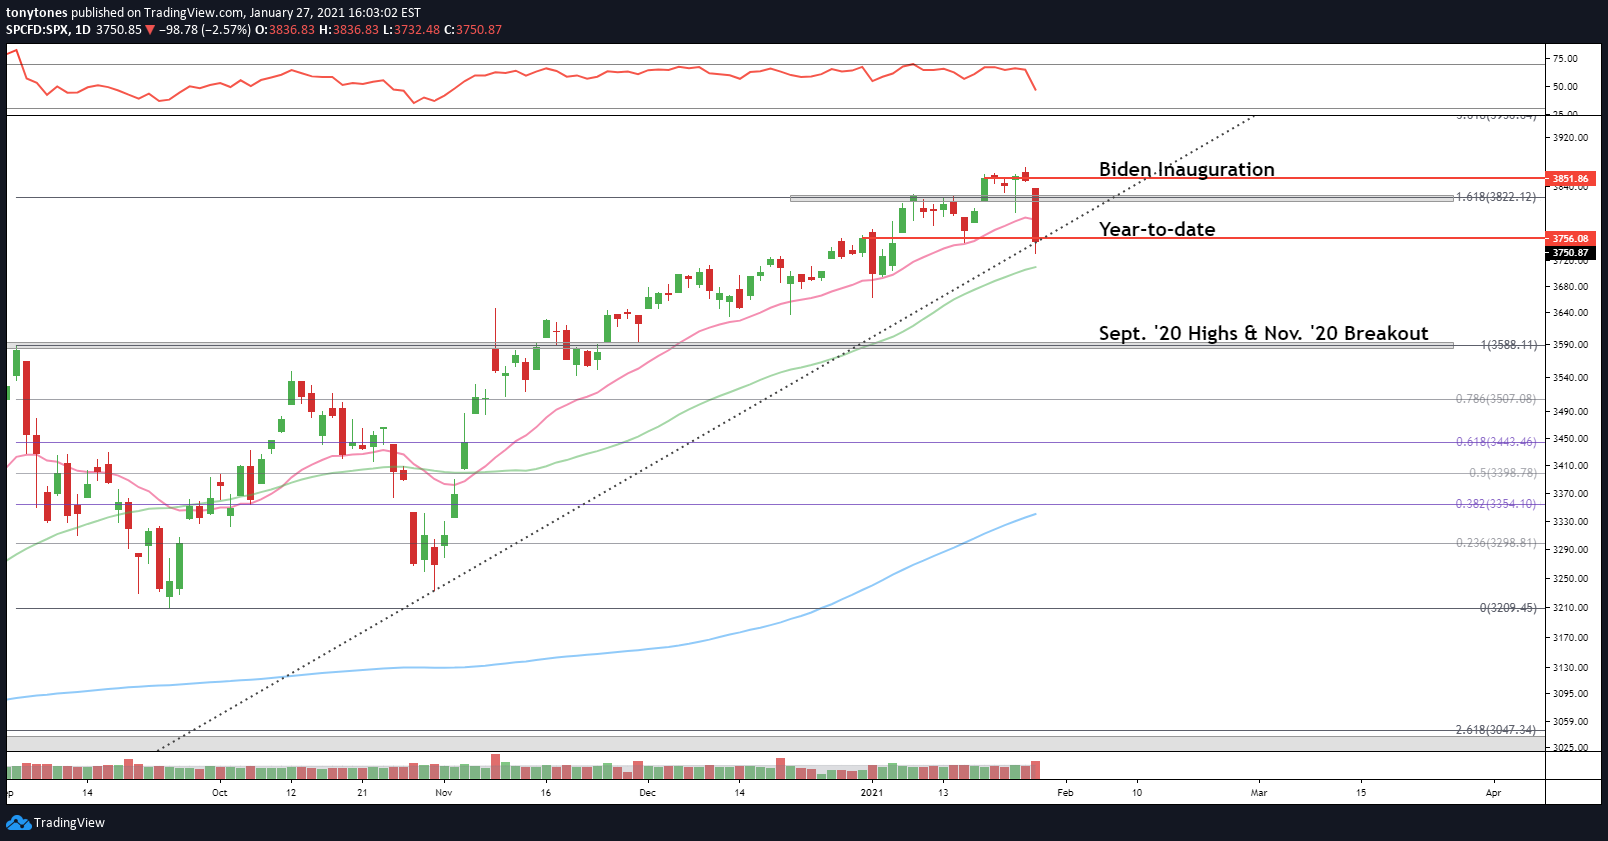
S&P 500 ($SPX): $SPX is sitting on its long-term trendline (dotted line) from the March 2020 lows and the later October lows and is now negative since the Biden inauguration and year-to-date (“YTD”). If the trendline breaks look to the rising 50-day simple moving average (green line) as the next level for support, followed by the September 2020 highs.
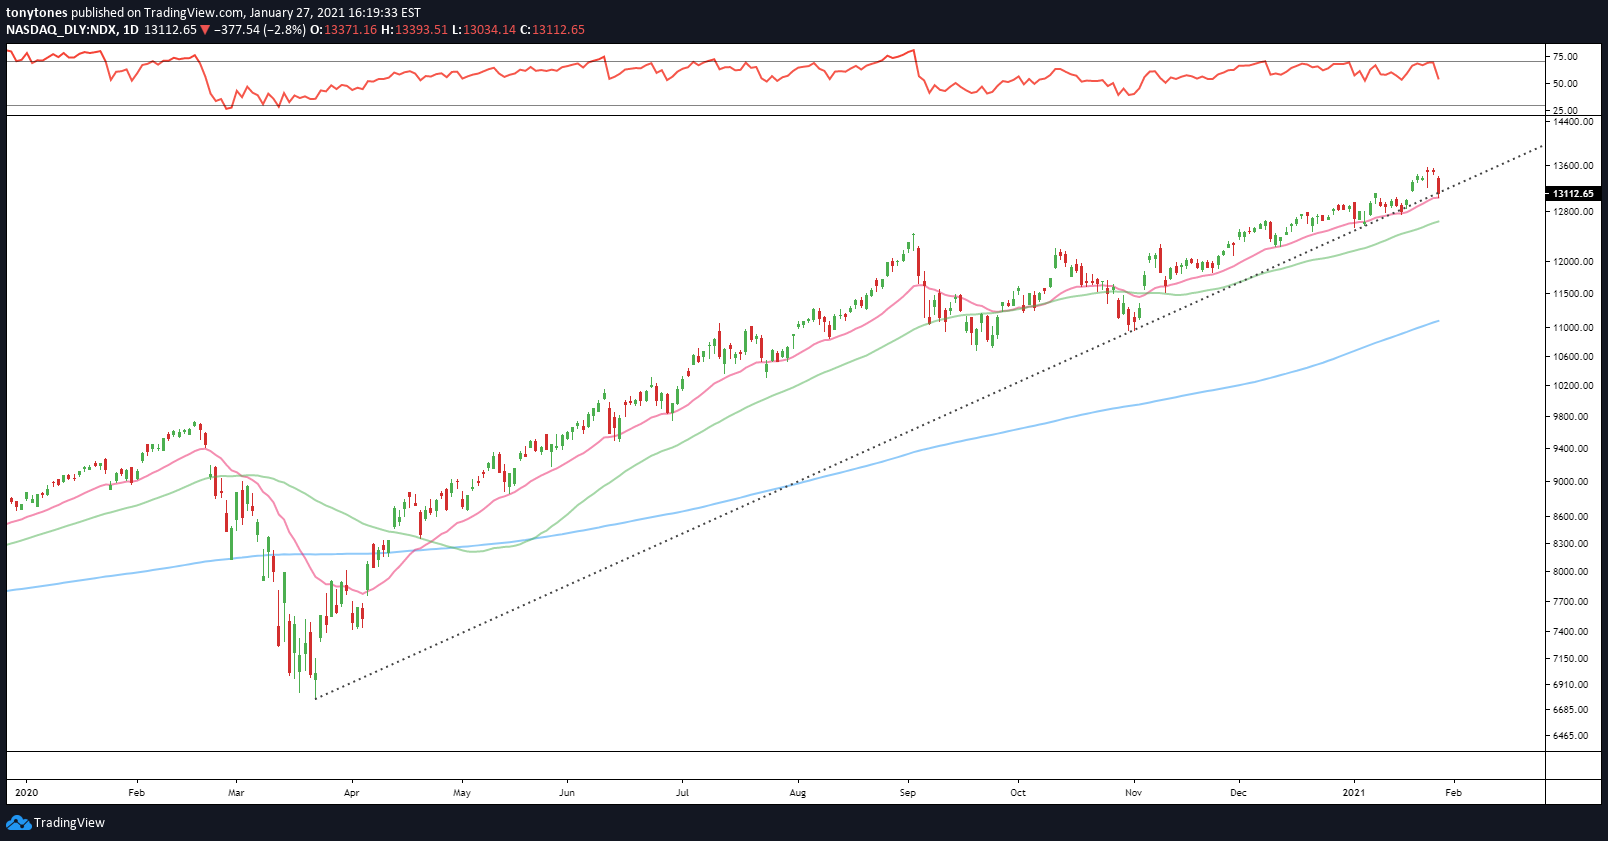
NASDAQ ($NDX): $NDX is also sitting on its long-term trendline from the March 2020 lows and the early October lows and is now negative since the inauguration, although still positive on the year. If the trendline breaks and it loses the 21-day exponential moving average (red line) look to the rising 50-day simple moving average as the next level for support, followed by the September 2020 highs.

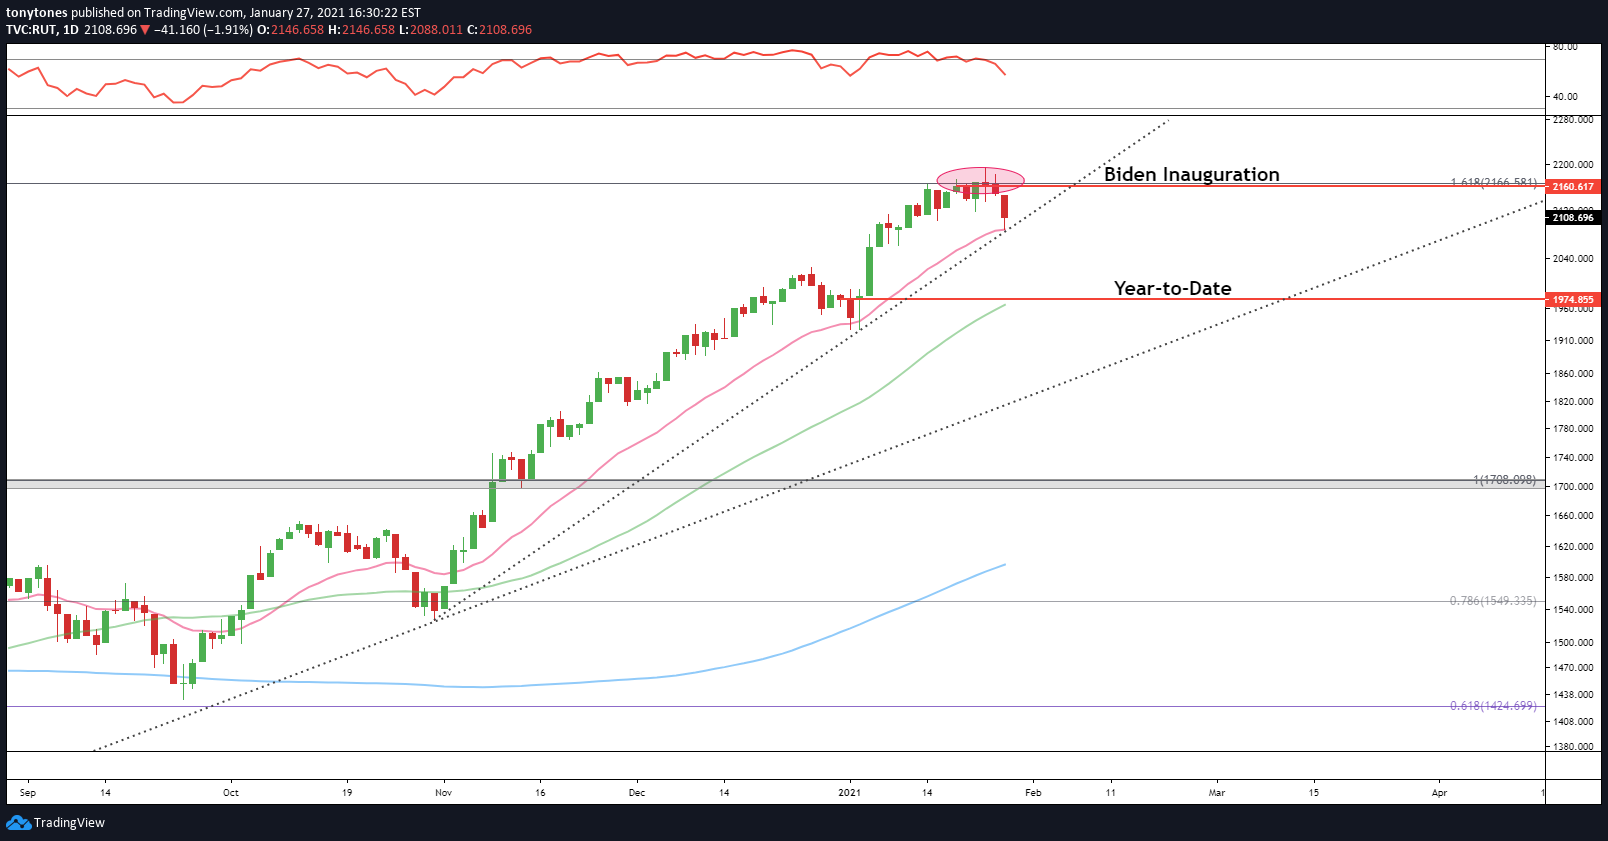
Russell 2000 Index ($RUT): $RUT is sitting on a shorter-term trendline and is now negative since the inauguration, although still positive on the year. If the trendline breaks and it loses the 21-day EMA look to the rising 50-day SMA and the early January lows as the next levels of support.

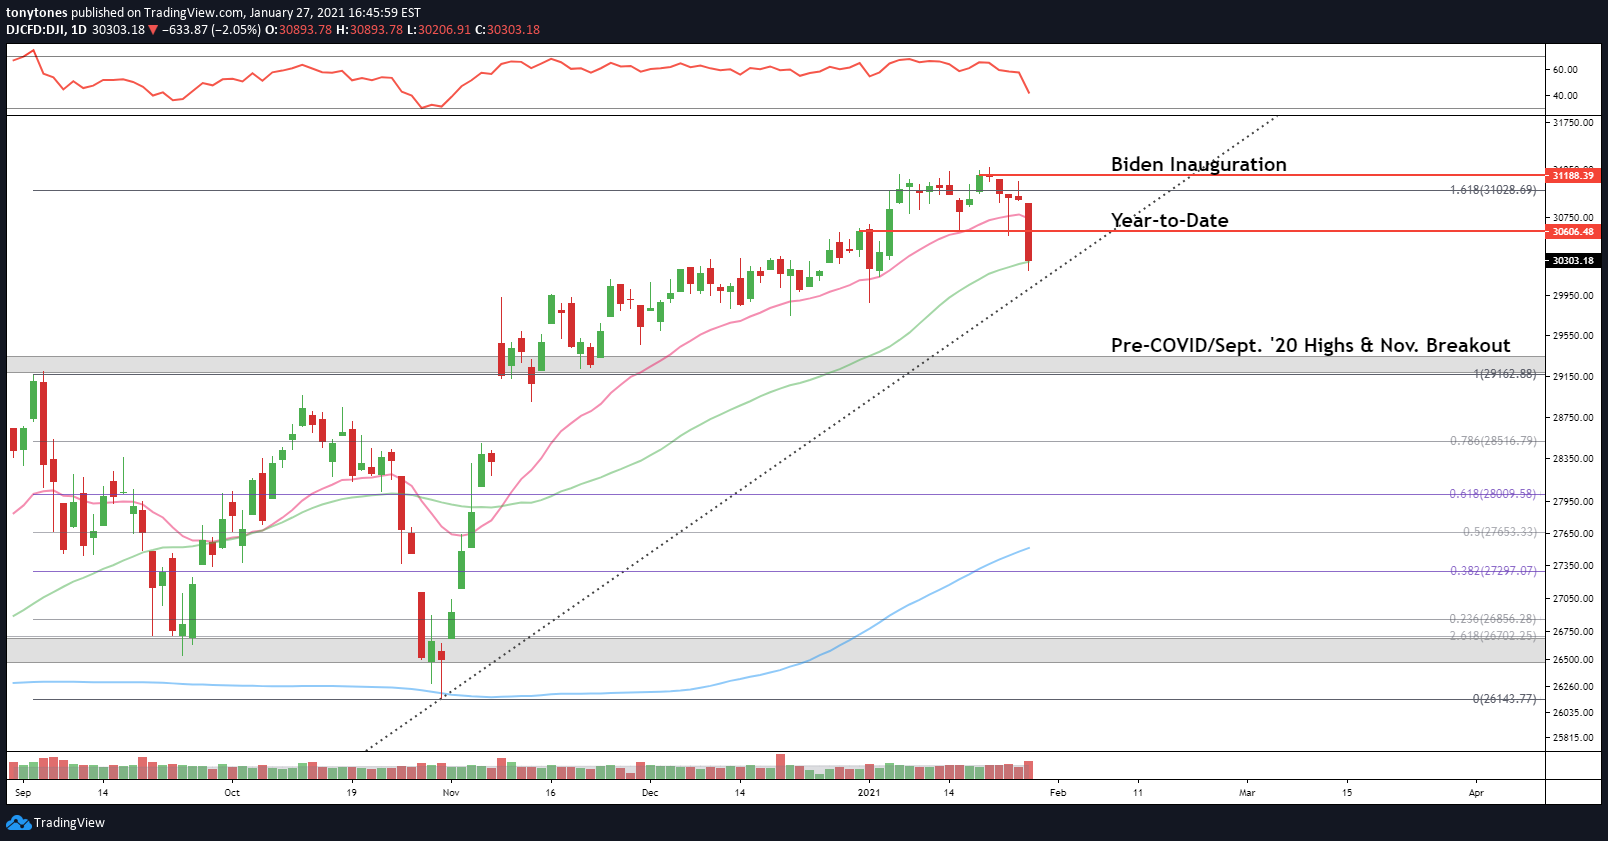
Dow Jones Industrial Average ($DJI): $DJI continues to lag the other indices. The blue-chip index is now negative since the inauguration and YTD and is sitting on the 50-day SMA. If that breaks look to the longer-term trendline as the next level of support, followed by the pre-COVID and September highs.

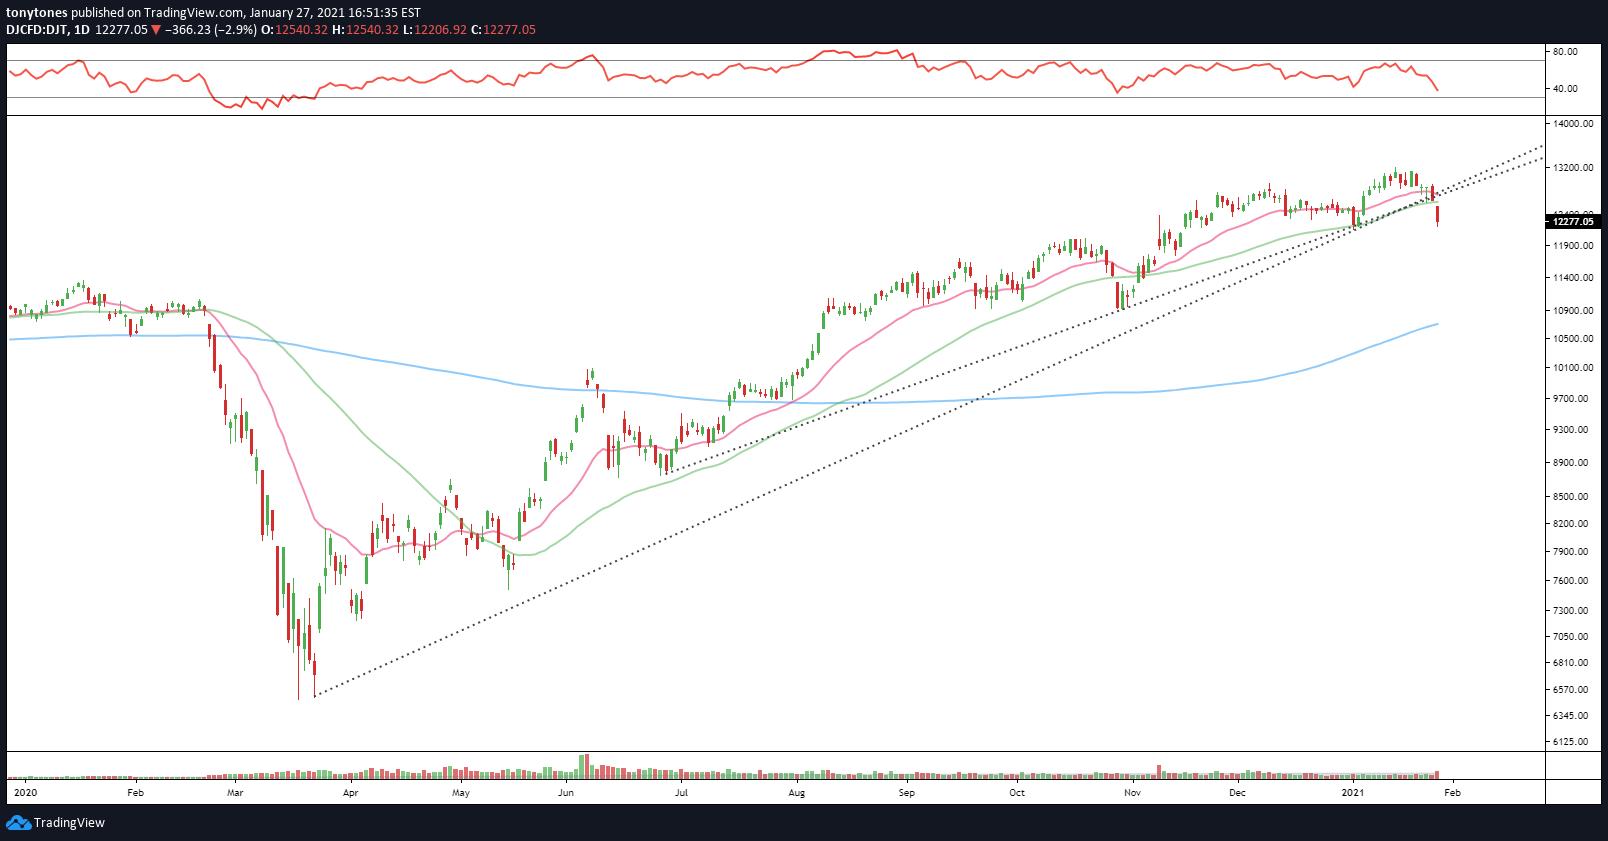
Dow Jones Transportation Average ($DJT): $DJT had an incredible run off the lows but the transports are now looking quite vulnerable. It is now negative since the inauguration and YTD and is below the 21-day EMA and the 50-day SMA. The current level looks like it could become support but there could be a decent air pocket below.

Philadelphia Semiconductor Index ($SOX): $SOX has beast an absolute beast and the undisputed market leader over the last year. The semiconductor index is below the inauguration highs yet still positive on the year and has some room before it reaches the longer-term trendline below. The level just below in the second chart looks like it could become support along with the trendline and the 50-day SMA. Losing strength in these names over the next few weeks would be a clear warning sign.


what else?
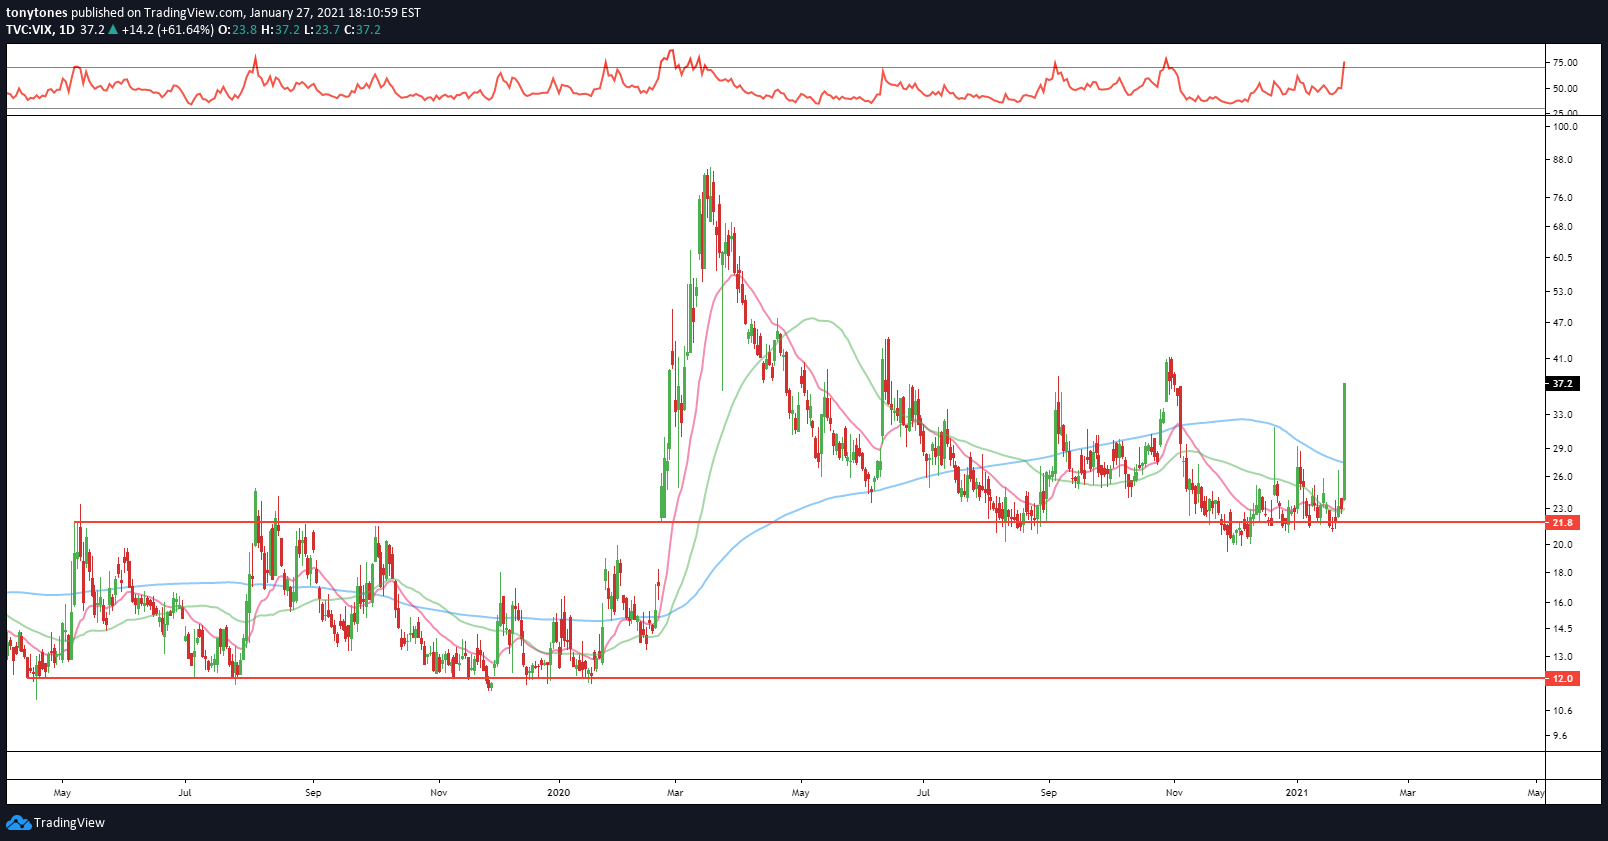
Volatility Index ($VIX): I don’t too much technical analysis on the $VIX but I do follow the general levels to assess the fear (or greed) in the markets. Today the $VIX surged over 61% to 37.2, the highest level since the presidential election in November. Bulls were hoping to see the $VIX finally crack the psychologically-important 20 level. Keep this on your radar.
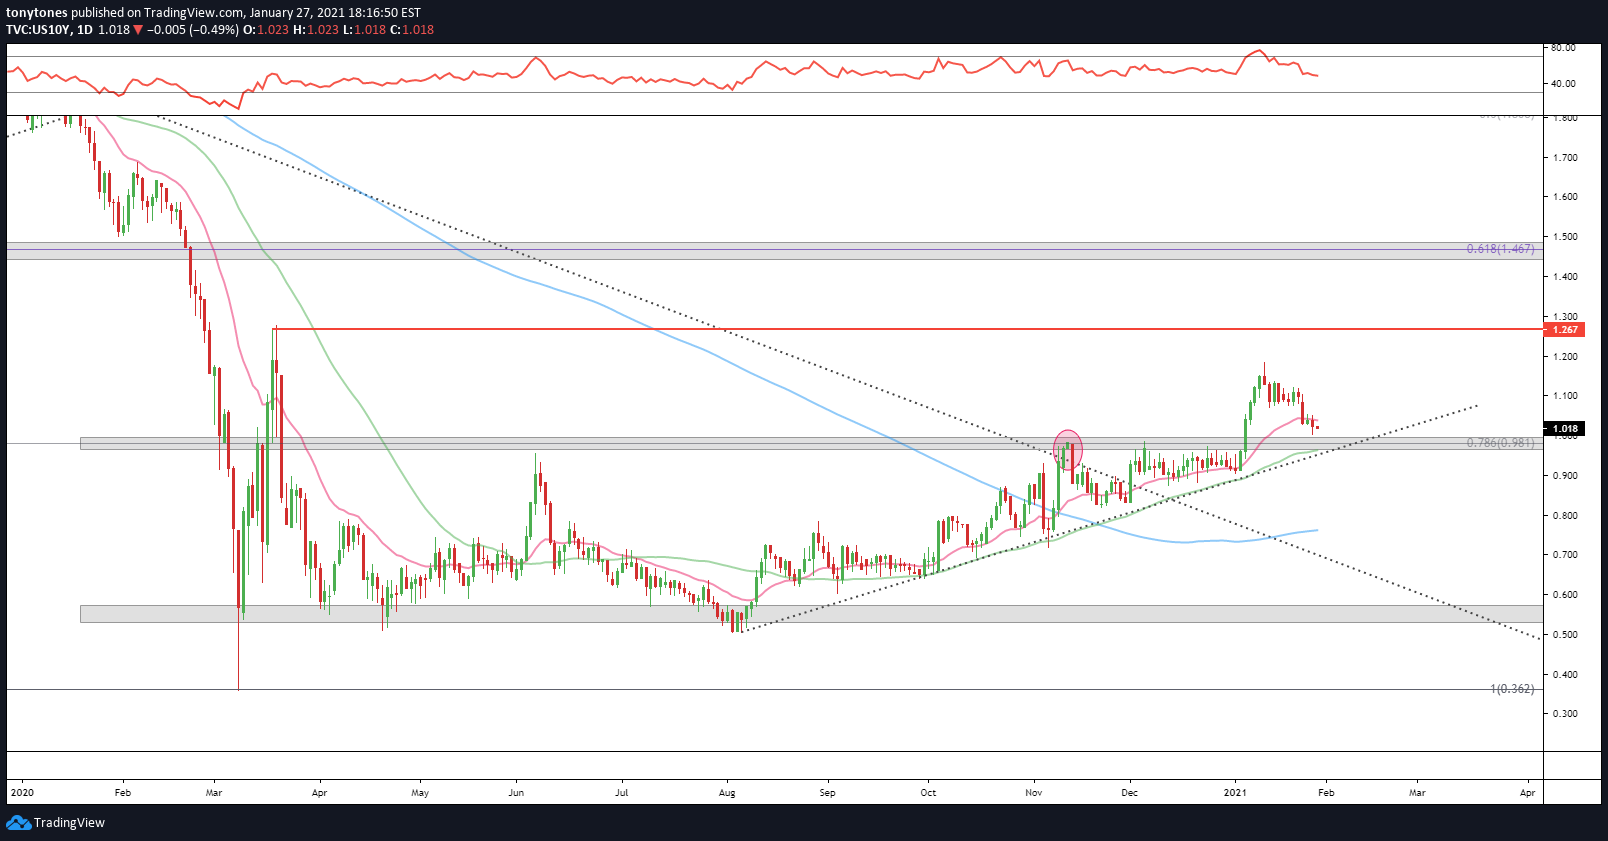
U.S 10-Year Treasury Rate ($US10Y): Another one to watch. Are long-term rates just revisiting the 0.98% level they broke out from before they resume higher, or are we going to see a full on risk reversal lower? A lower Treasury rate means people are buying bonds and getting defensive.
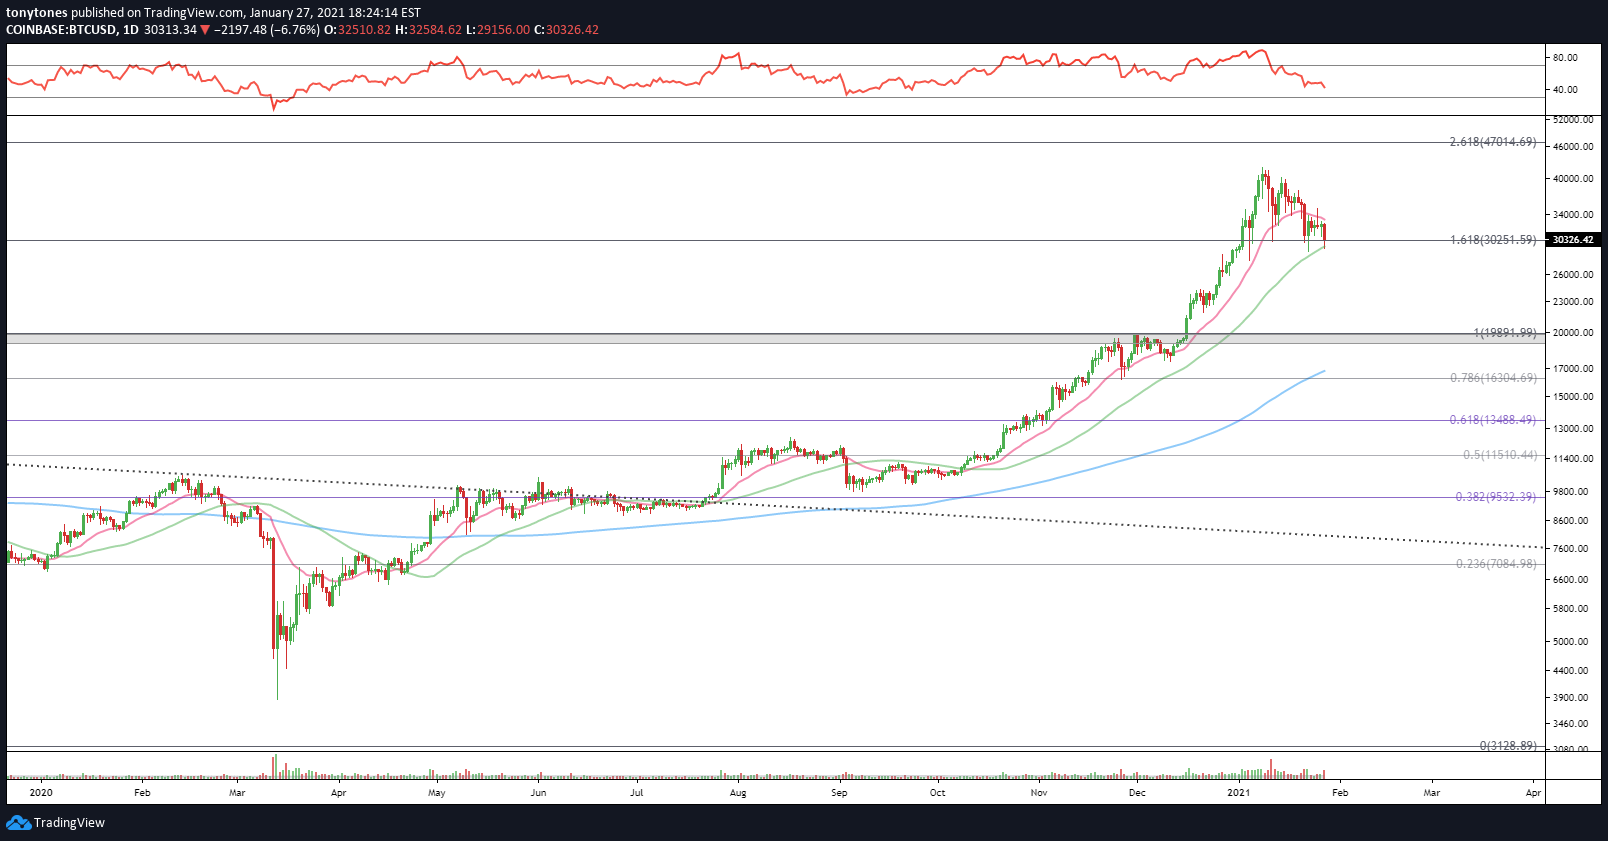
Bitcoin ($BTCUSD): Look who’s back! $BTCUSD is back at the now infamous $30.25K level for the fourth time since I shared the chart. Not sure this is as important for sentiment as I am leading on but let’s keep an eye on it. Remember that the other half of the sentiment post was $TSLA, which just reported earnings is down hovering around $829 in after hours trading. $789 was the key level to watch there.
my thoughts
Lots to watch. Many of the major indices are starting to give some short-term caution signals and our risk measures are telling a somewhat similar story. If these signals change from yellow to red we’ll want to determine whether this is a much needed, healthy pullback or the beginning of something more significant. The Big Tech earnings that came out tonight looked fine relative to expectations and the larger trend is up for now. Maybe just a little scare for humility’s sake? We’ll see!

share with friends
Again, I can’t express my gratitude to everyone that has subscribed and provided great feedback to me as I have started sharing my analysis. If you have anyone you think would enjoy my work, please feel free to share it.