troops leading the generals
troops leading the generals
A look at relative strength among the mega-caps

Last week we reviewed the various investable asset classes through the lens of absolute and relative strength. While equities looked strong relative to more defensive assets, such as fixed income (bonds) and precious metals, this week I am digging deeper into equities by analyzing them through relative strength against one another.
The generals
Back when the largest stocks in the U.S. were industrial behemoths like General Electric ($GE) and General Motors ($GM) led the market, they were referred to as the Generals. Today’s generals are mega-cap technology giants — Apple, Microsoft, Amazon, Facebook and Google, which represent the largest components of the S&P 500 (excluding the newcomer, Tesla).
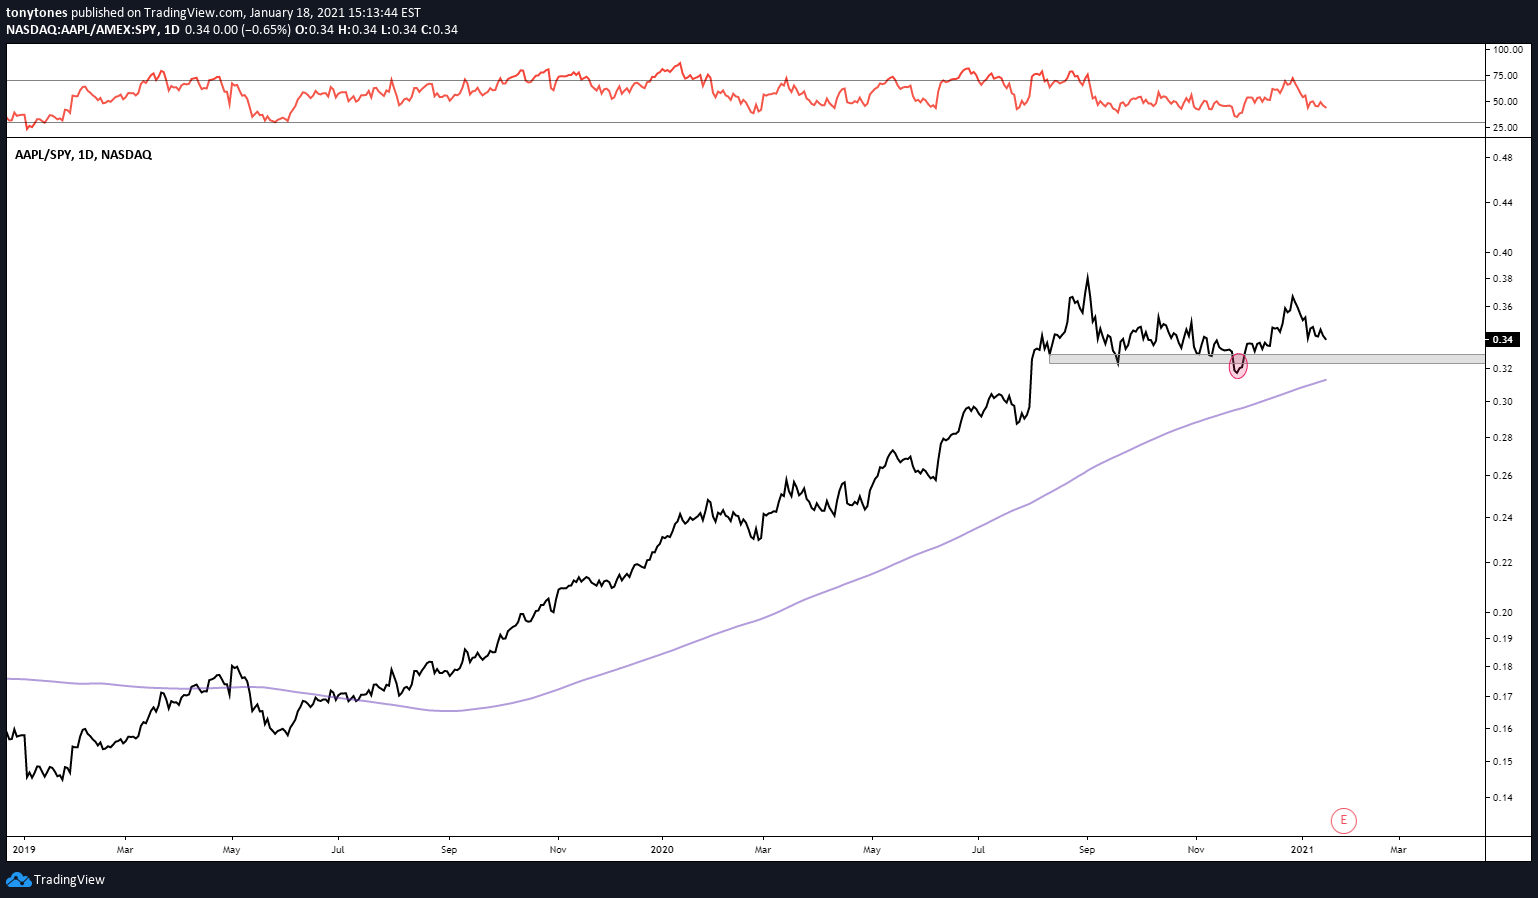
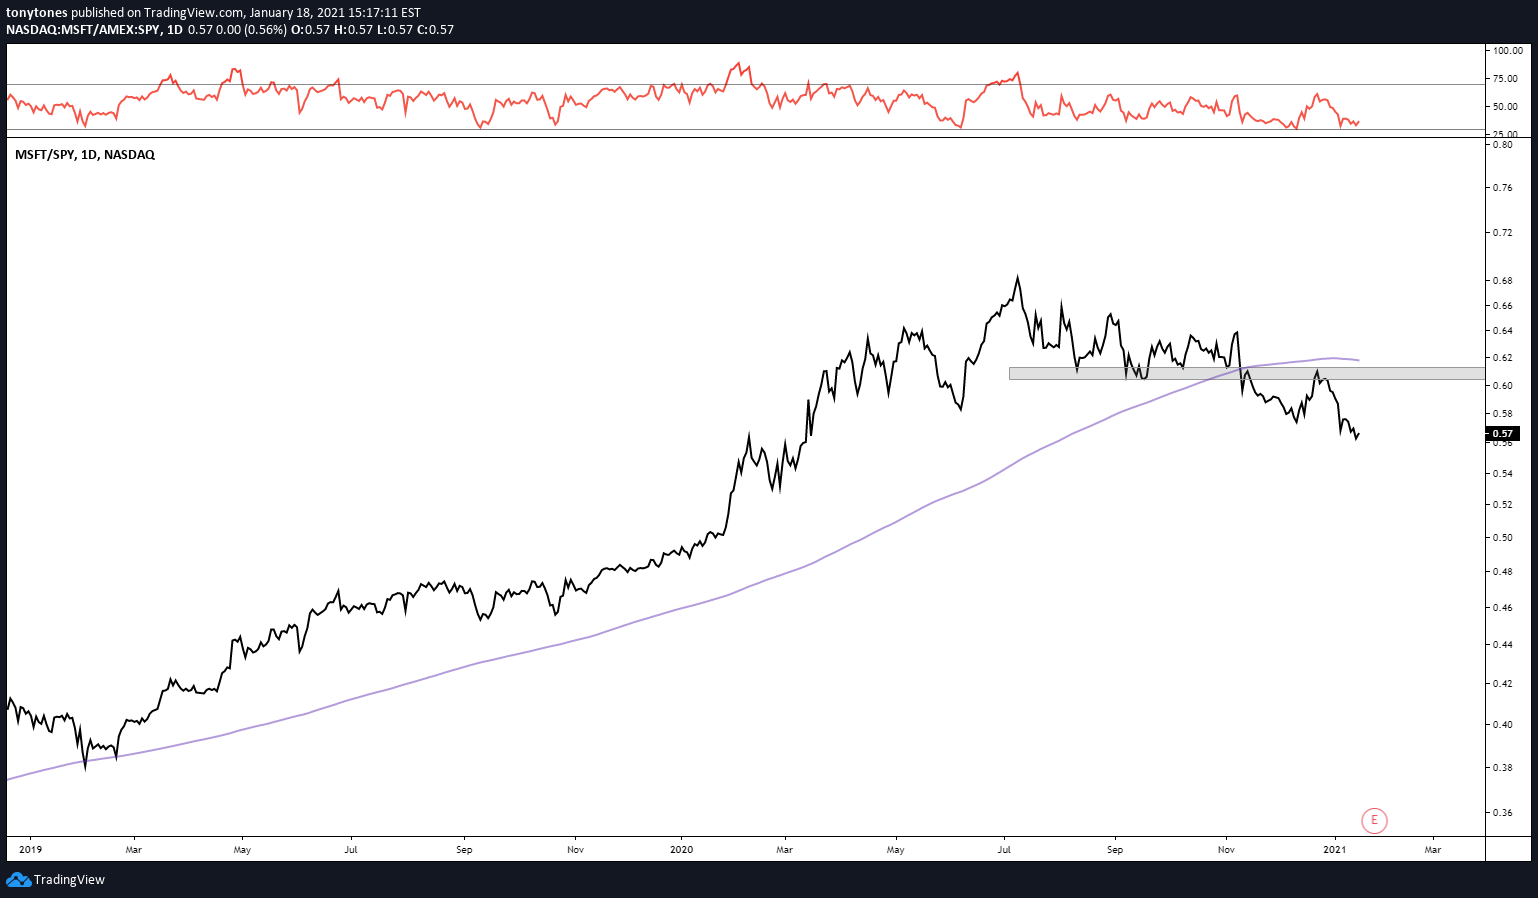
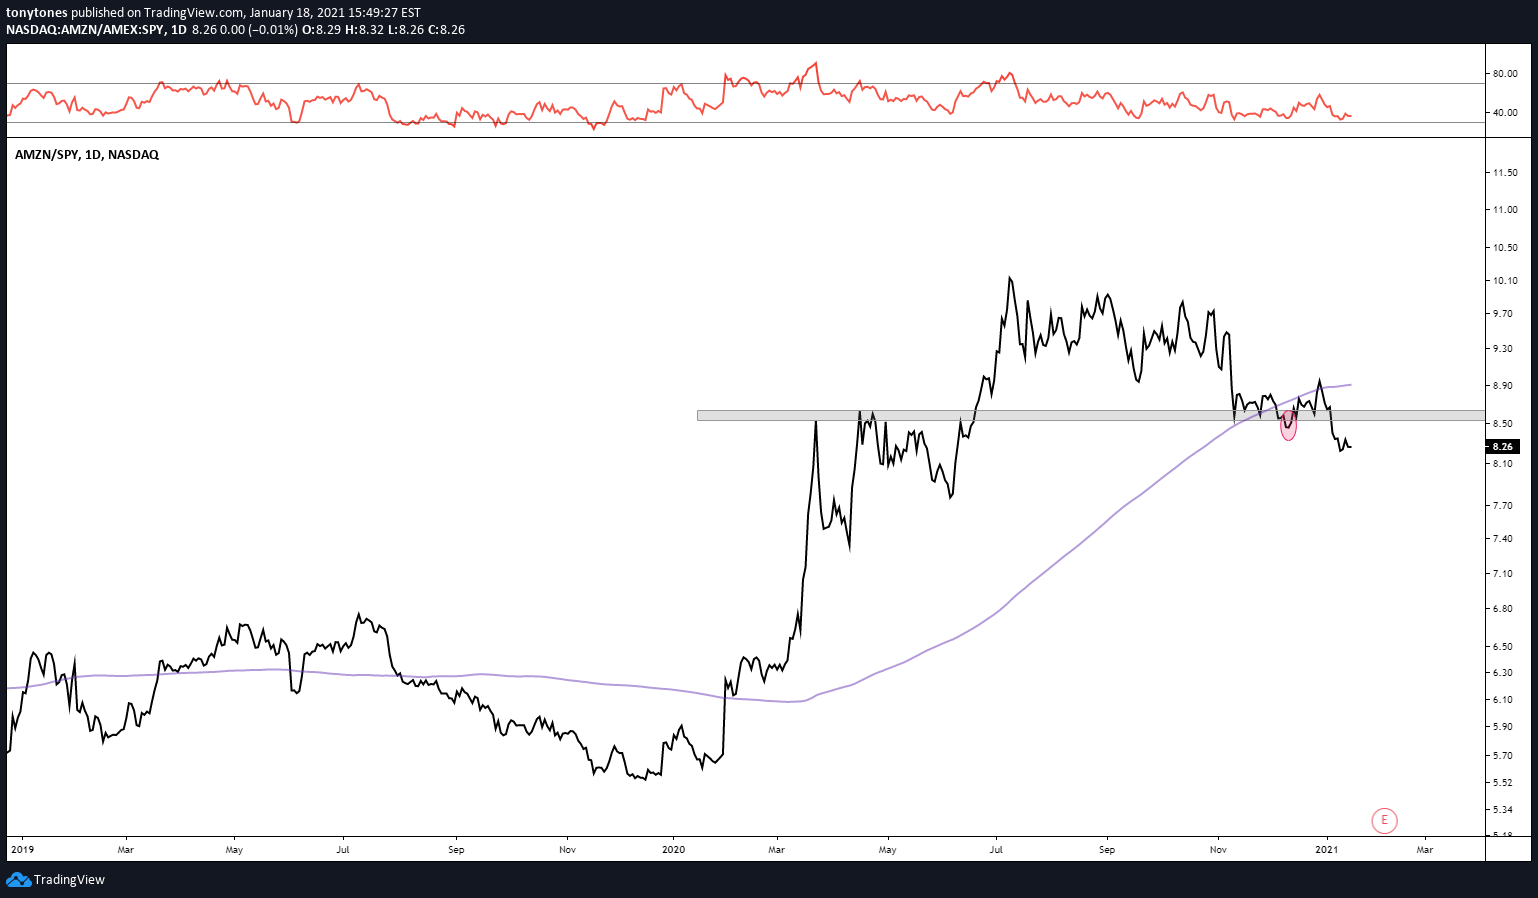
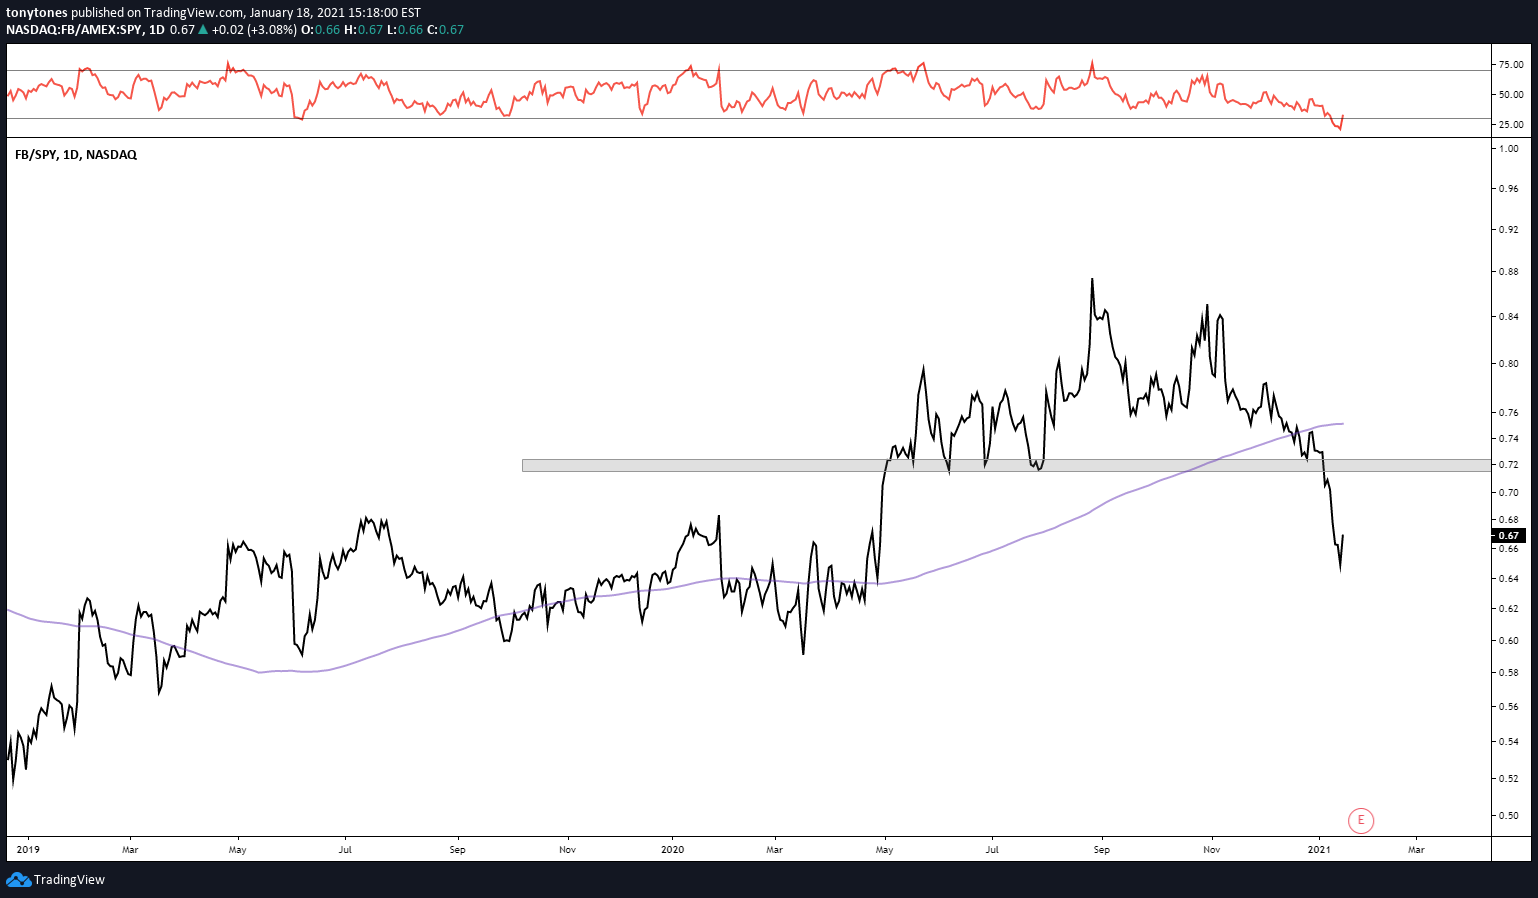
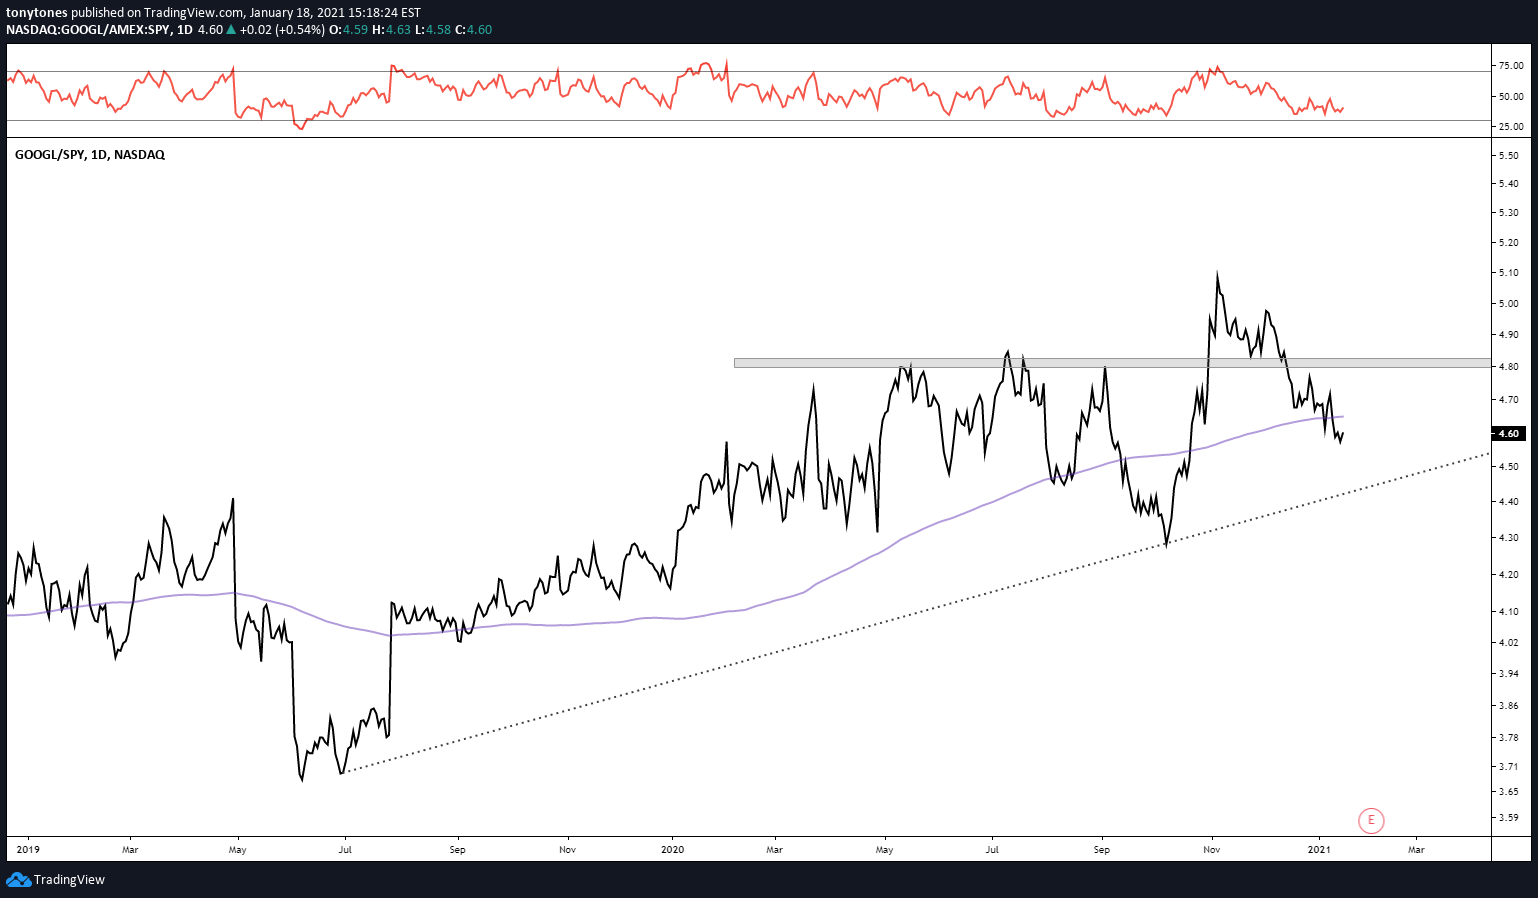
If we look at relative strength for each of the generals versus the S&P 500 it is clear they have begun to lag over the last few months after years of outperformance. Should this be interpreted as a bad thing?
Apple ($AAPL) versus S&P 500 ($SPY):
Microsoft ($MSFT) versus S&P 500 ($SPY):
Amazon ($AMZN) versus S&P 500 ($SPY):
Facebook ($FB) versus S&P 500 ($SPY):
Google ($GOOGL) versus S&P 500 ($SPY):
At ease
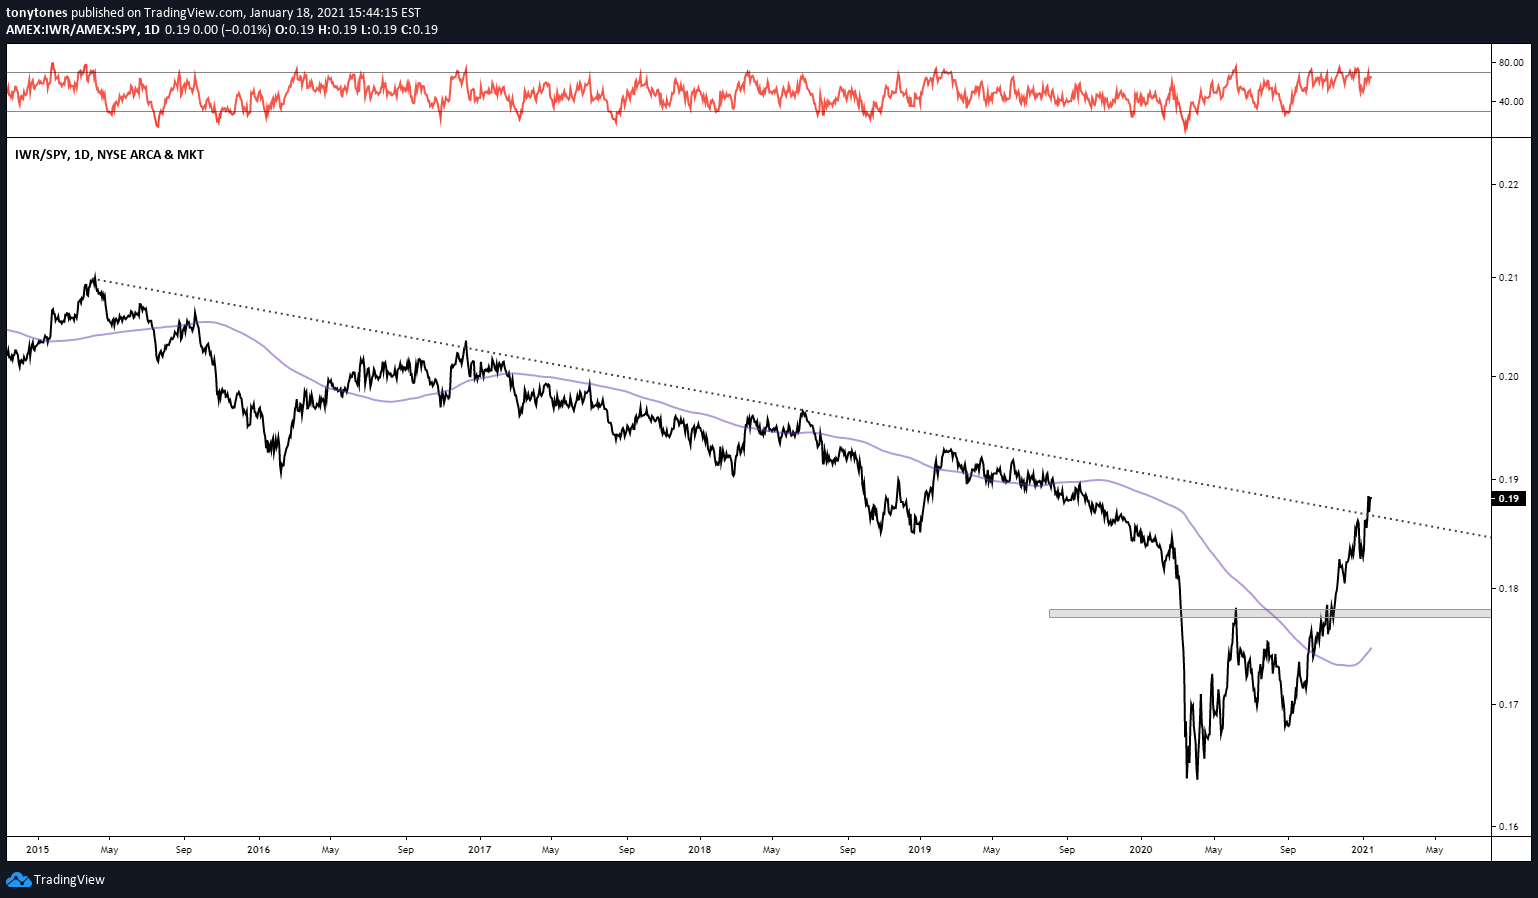
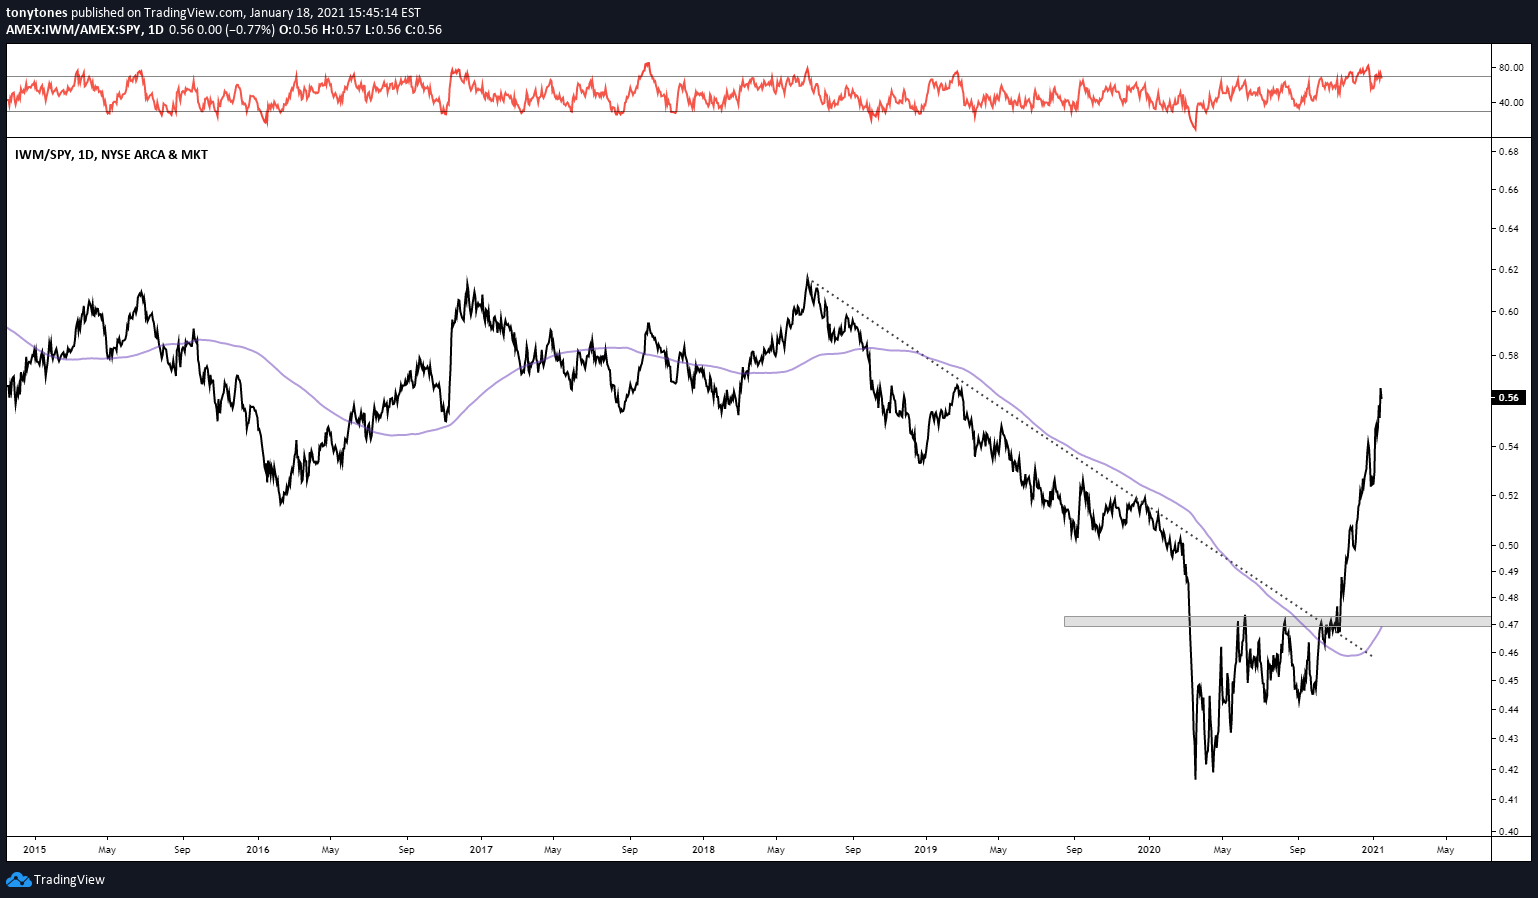
Relative underperformance of the generals isn’t a bad thing when we see broader market participation, known as breadth, by the troops. By “the troops,” I am referring to the smaller stocks that are typically more sensitive to risks in the economy. The charts indicate that market participants are willing to buy the riskier segments of the market over the typically safer, more stable Generals. To me, this indicates higher risk sentiment.
If smaller, more sensitive stocks are outperforming their more defensive brethren are investors expressing concerns about the future? Let’s look at some charts.
Russell Mid-Caps ($IWR) versus S&P 500 ($SPY):
Russell 2000 Small-Caps ($IWM) versus S&P 500 ($SPY):
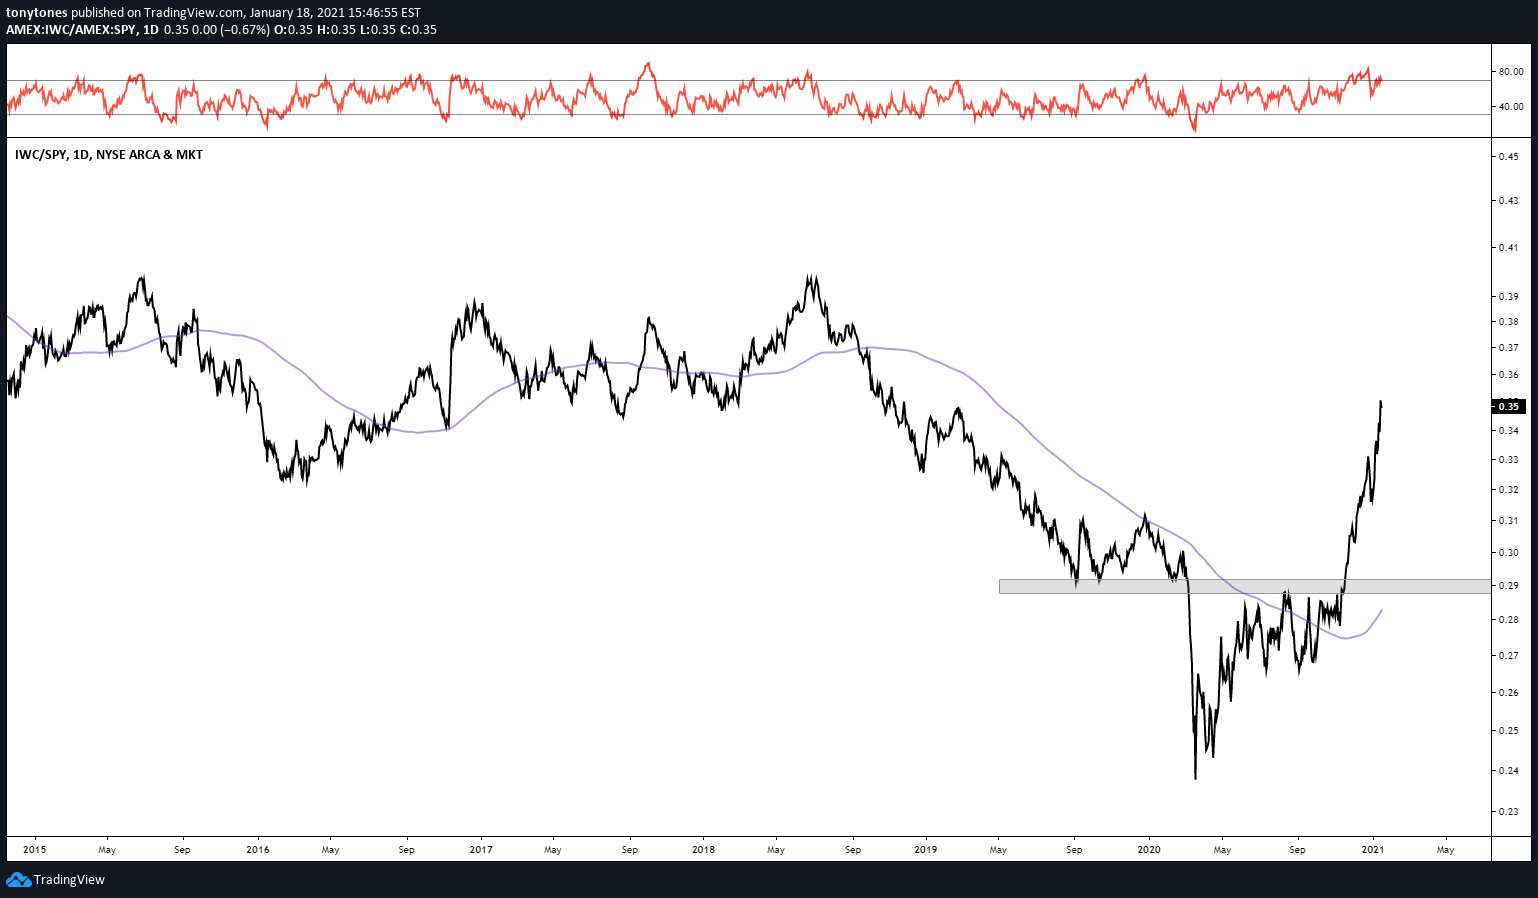
Micro-Caps ($IWC) versus S&P 500 ($SPY):
All in all, breadth among stocks over the last few months has been quite remarkable. As we saw in last week’s post, the phenomena is occurring across smaller U.S. stocks as well as in international developed ($EFA) and emerging market ($EEM) equities. This is generally a positive for the markets.
What else?
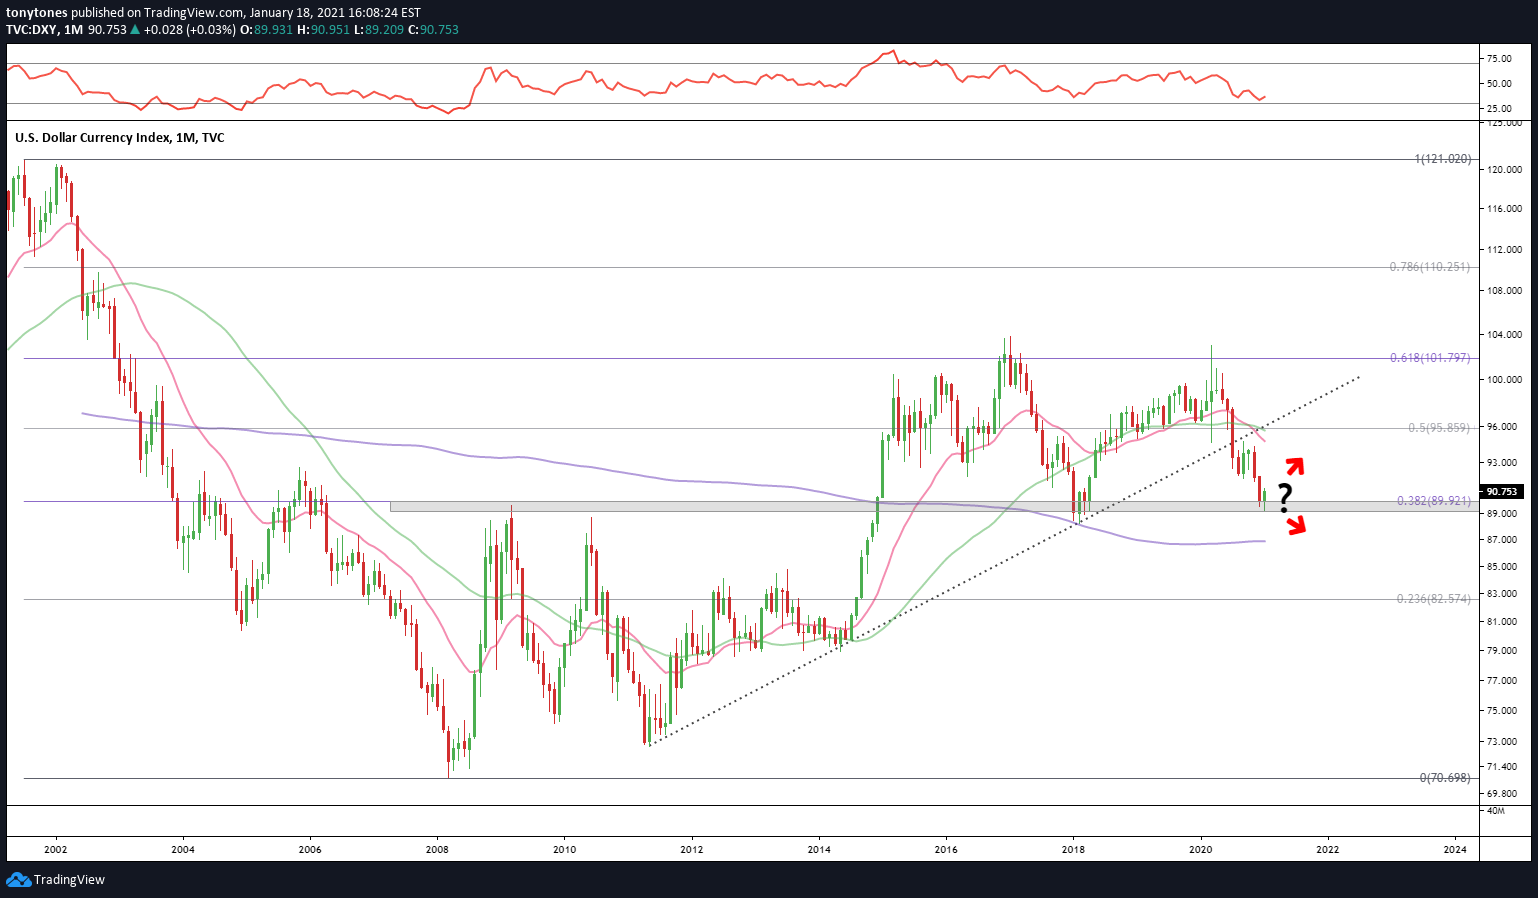
While the relative strength analysis of asset classes and stocks over the last two weeks has been quite positive, I am still watching U.S. Dollar Index ($DXY) chart from last week’s post.
I had mentioned that $89 and change there was an interesting level for a potential reversal and so far the reversal has held up. Is this a change in trend or a short-term pause within a larger downtrend? If it’s the latter I would continue to lean towards the risk-on bias.