

pet rock

Happy Memorial Day! Hope everyone had a great weekend.
Gold hasn’t gotten much love recently. Despite massive deficit spending, quantitative easing (“QE”) and other fundamental issues that “goldbugs” often cite as to why gold should skyrocket, the pet rock hasn’t done much since peaking last summer.
Speculators essentially lost interest and decided Bitcoin was their new digital gold. After a nearly 20% correction and a year of no progress, it may be gold’s time to shine.
Here’s the weekly chart for Gold Futures contract ($GC1!). They met a ton of overhead supply above former 2011 all-time highs (“ATHs”) last summer underwent a correction in both price and time, ultimately finding support around $1,700/oz. Above $1,920 looks like a great level for $GC1! to continue its run higher to new ATHs.

The more interesting aspect of the Gold Futures chart is the current analog against last major bull run, from the early 2000’s to 2011. Here’s the monthly chart to compare the two.

Notice the similarities:
large climatic tops (see 1980 and 2011) ✅,
prolonged bear markets followed by rounding bottoms ✅,
strong runs to all-time highs (see 2008 and 2020) ✅,
selling at overhead supply and followed by sharp corrections ✅, and
reversals at old highs (see red arrows) back towards ATHs ✅
Analogs are never perfect and can fail to repeat themselves. Fortunately, we have logical levels to trade against in case things don’t pan out. Above $1,920, look for Gold Futures to target last year’s ATHs and then $2,465-95.
Here’s the monthly Gold Trust ETF ($GLD) levels for those unfamiliar with futures. $184.80 is the key there.

intermarket implications
If gold breaks out, what could that mean for other asset classes? Rates are the first to come to mind.
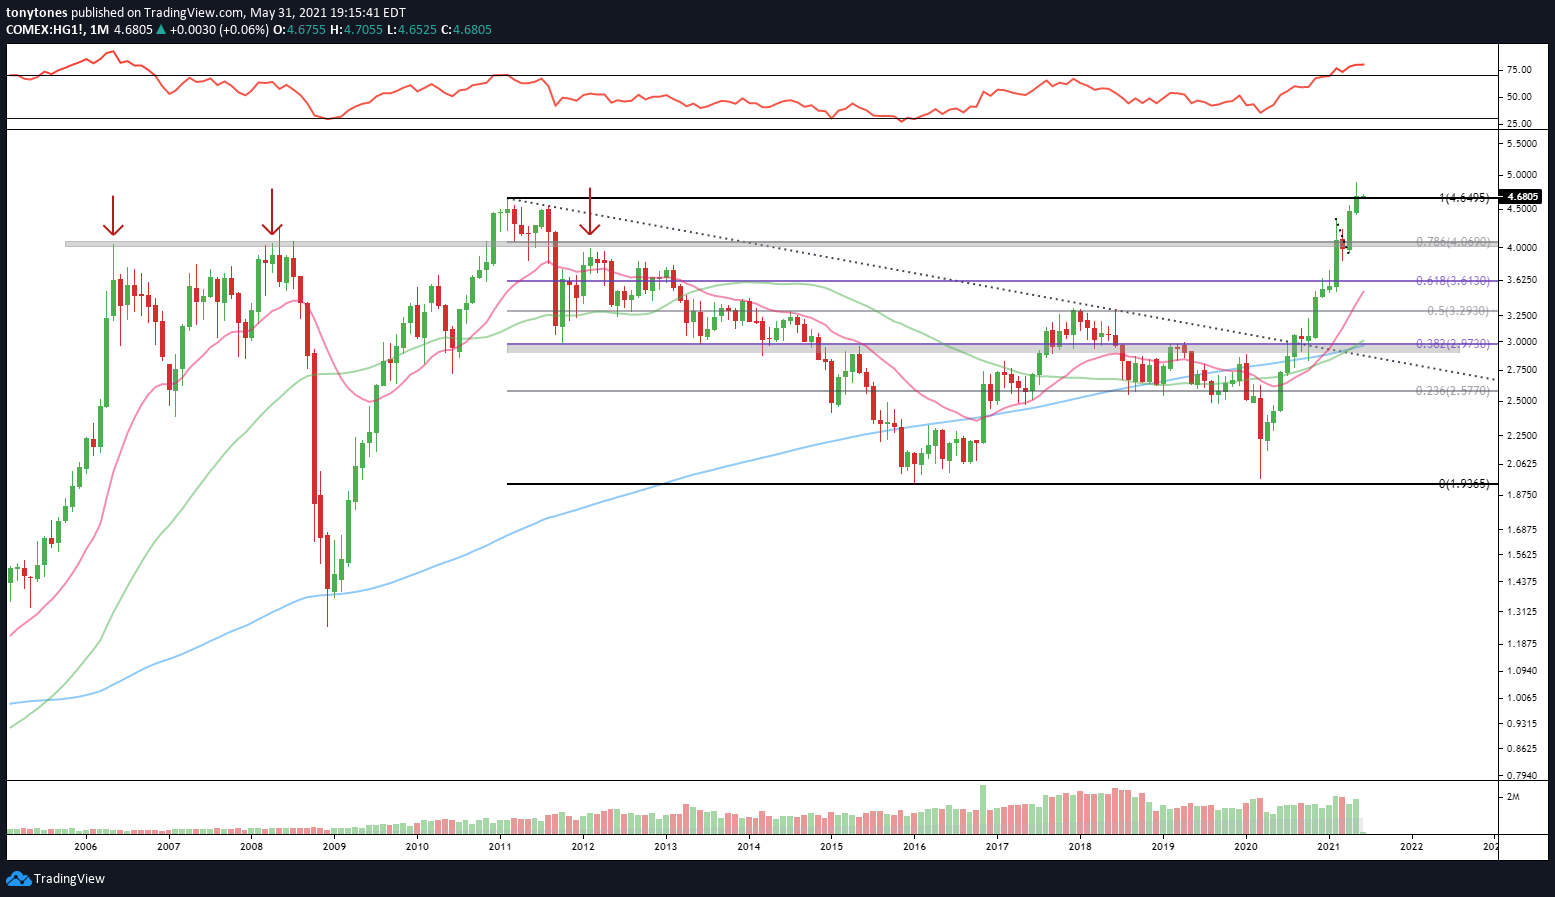
We’ve used the ratio of Coper Futures ($HG1!) to Gold Futures ($GC1!) many times in the past as a proxy for interest rates. Here’s that chart again with what looks like a false breakout at prior highs.

Are the highs in for rates? Let’s keep an eye on what happens with that ratio.
Similar to gold, Copper Futures are hovering near our target of $4.65, which are the ATHs from 2011. That’s a nice level to trade against for copper.
Here’s the 10-Year U.S. Treasury Rate. Still above our 1.465% target from earlier this year but struggling at the upwards-sloping trendline.

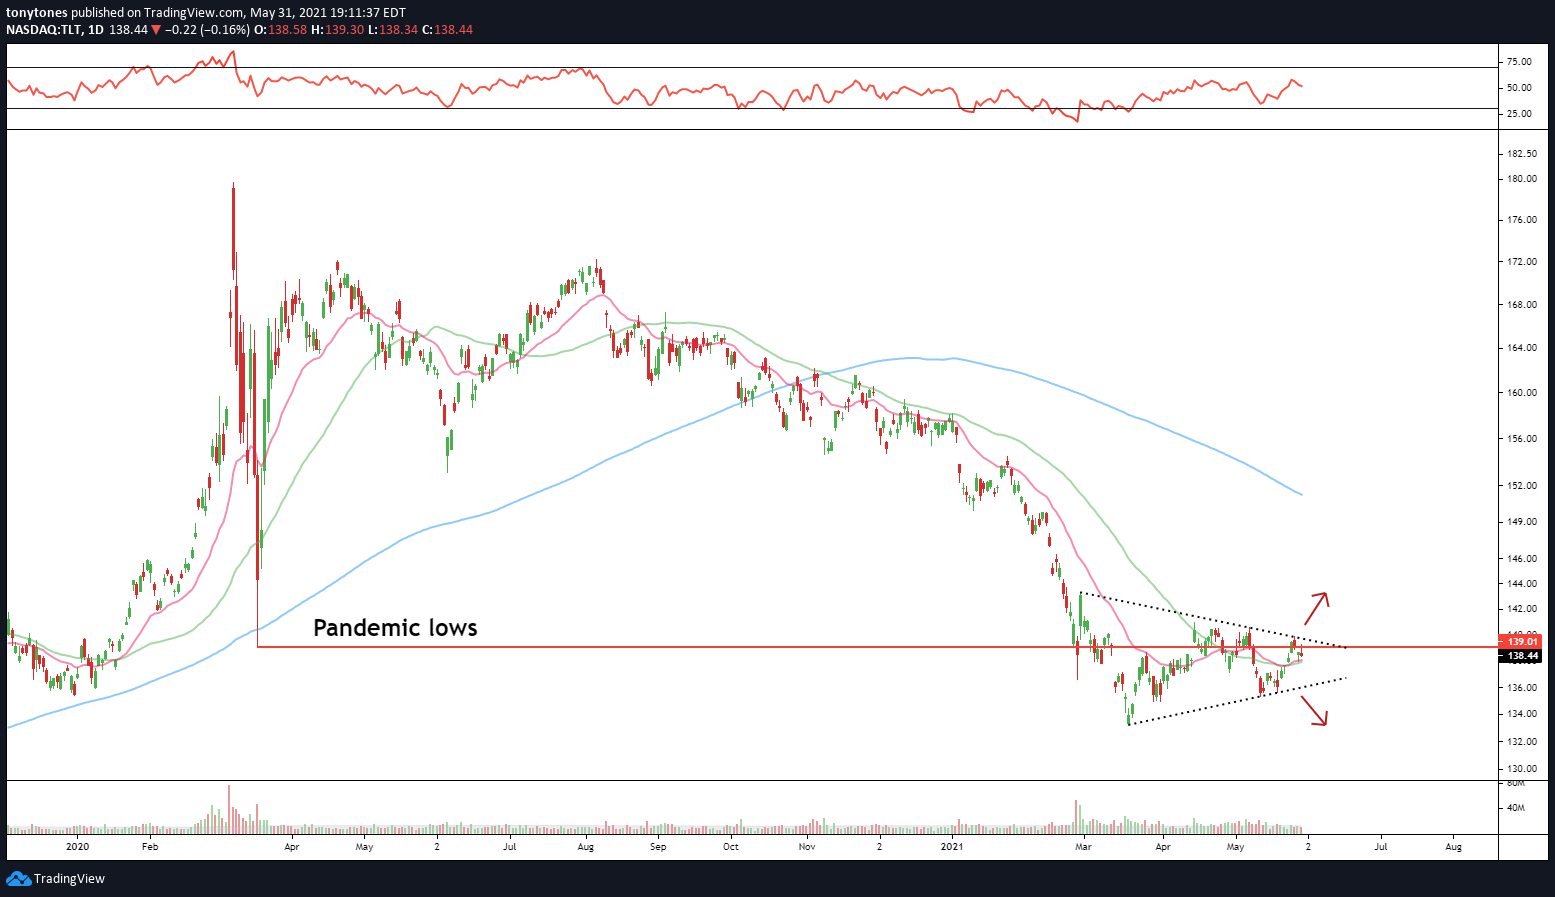
Lower rates would mean higher bond prices. Here’s the 20+ Year Treasury Bond ETF ($TLT). Looks like a bear flag to me but let’s see what happens. Nothing is more explosive than a failed continuation pattern (downwards continuation in this context).
And what does this all mean for the U.S. Dollar Index ($DXY)? Maybe we can finally break down through our $89.9 level?

takeaway
The gold chart continues to look interesting, especially as we approach that $1,920/oz level on the futures. If the 2008 analog is any guide, we could be approaching the beginning a bull run higher.
Depending on how gold performs relative to copper, maybe the highs are in for interest rates? That would surely catch many pundits offsides in a big way… I’m open to any scenario, maybe gold and copper can both rally to new highs?
If gold rallies and rates roll over, can we super bullish on equities? Lots to watch.
Have a great evening. Cheers!