

overhead supply

It’s been a rough week for many assets. Just ugly.
Fortunately, we avoided the areas experiencing the most acute pain, tech and growth. We covered some concerning charts in the last post here.
overhead supply
I learned about overhead supply from an idol of mine, JC Parets. He defines it as follows:
“Overhead supply is when there are an overwhelming amount of sellers relative to the amount of buyers around a certain price.”
Unfortunately, many parts of the market are currently trading beneath overhead supply. We’ll focus on those, many of which we have review recently.
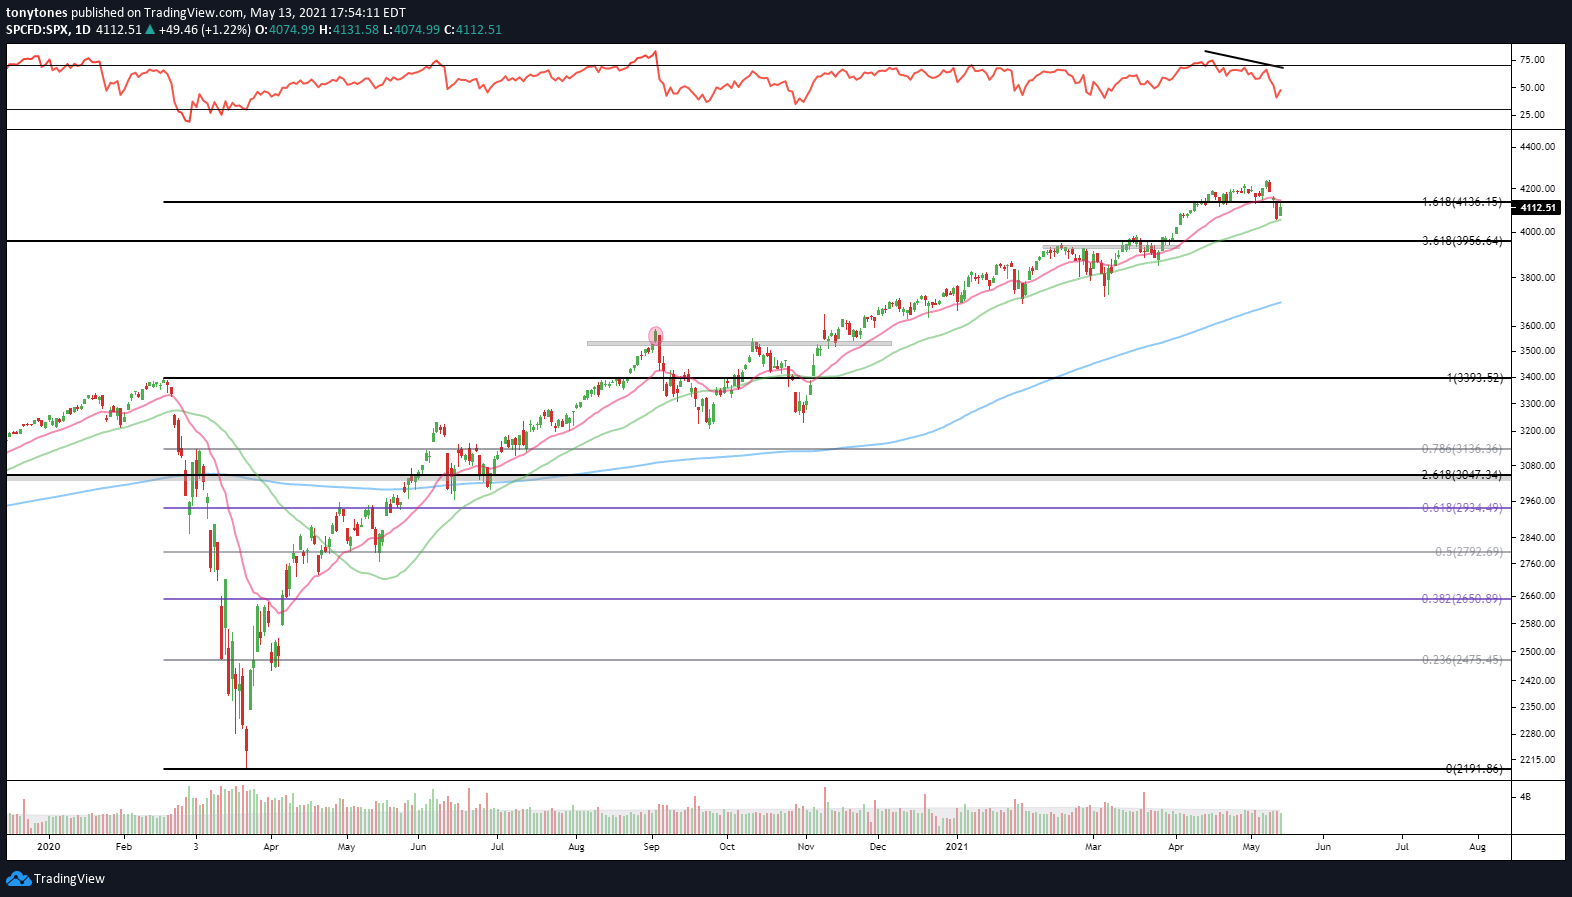
S&P 500 ($SPX): Back below the $4,137 level we had as our target in late March, which is now overhead supply for us to overcome.
To keep this concise, we’ll review each chart and highlight the important levels of overhead supply. Keep it simple, bullish above and cautious below.
Russell 2000 ($RUT): $2,200

S&P 400 Mid-Caps ($MID): $2,683

NASDAQ 100 ETF (QQQ): ~$337

Philadelphia Semiconductors Index ETF ($SOXX): $433, $389 below is a must hold level.

Crude Oil Futures ($CL1!): $66

S&P Energy Sector ETF ($XLE): ~$55

Thomson Reuters Core Commodity CRB Index ($TRJEFCRB): $207

Review the charts. Note the key levels of overhead supply we move forward.
Have a wonderful evening. Cheers!