

fibs in practice

Readers are accustomed to me referring to Fibonacci ratios. I think every serious technical analyst and trader should utilize them.
Many people think they are nonsensical and see using “golden ratios” for financial markets as foolish. Their loss.
During today’s chaotic Bitcoin ($BTCUSD) selloff, I used my handy “fibs” to find a logical end point for the ~30% intraday decline. Here’s the chart from the tony charts Twitter page this morning.


1.618 Fibonacci level: $30,098. Low of the day: $30,000.
Here’s the 5-minute $BTCUSD intraday chart to see the action as it happened. Nearly $13K rally from our key level.
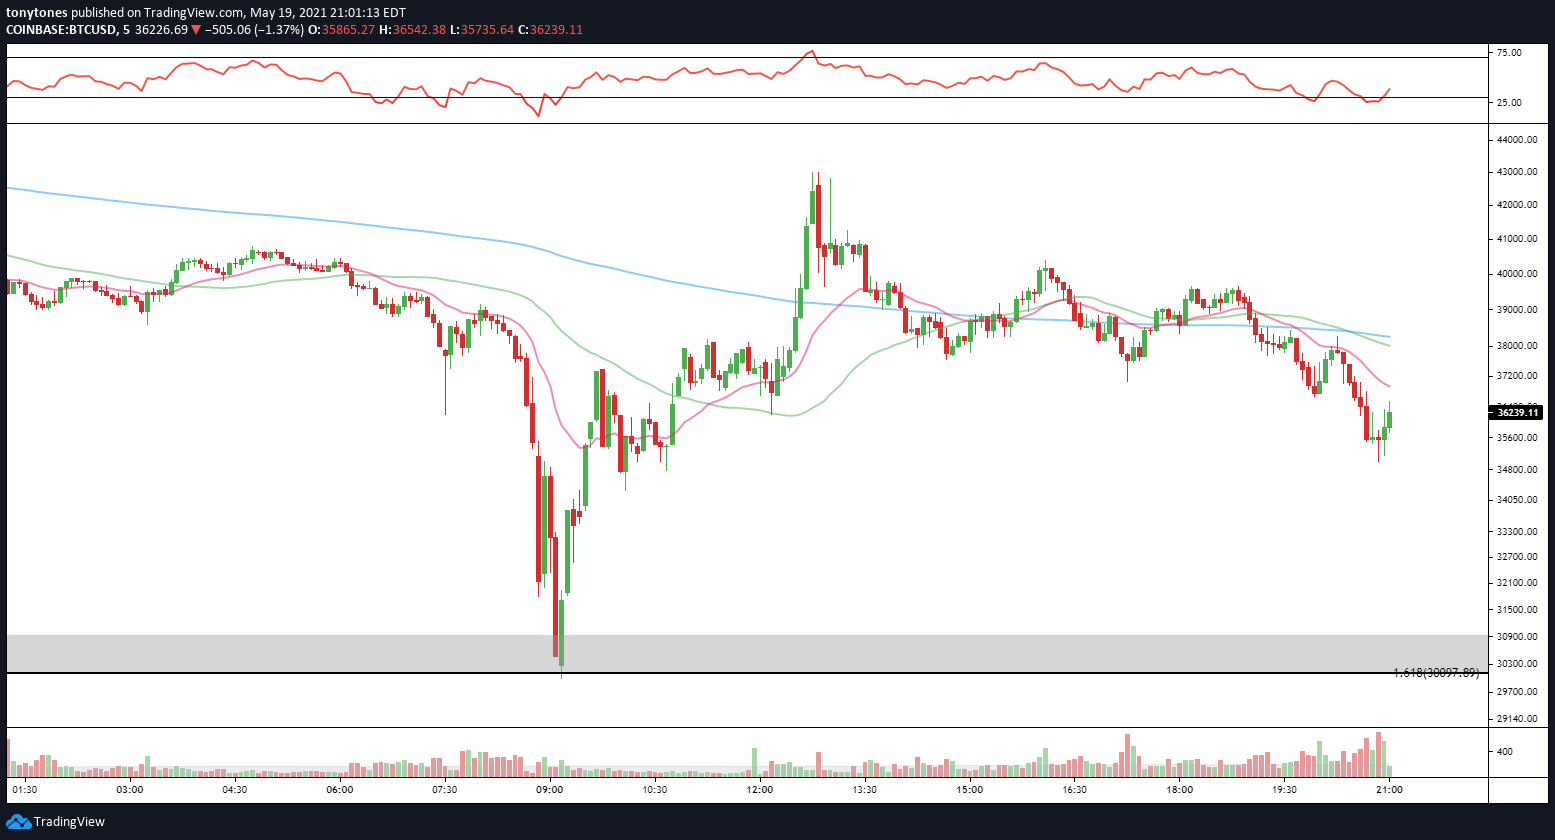
Here’s the current look at the $BTCUSD daily chart. Quite the mess in between two major fib levels, the 1.618 ($30,098) and the 2.618 ($46,766).

Expect more whipsaw price action on this ugly chart.
Cheers!